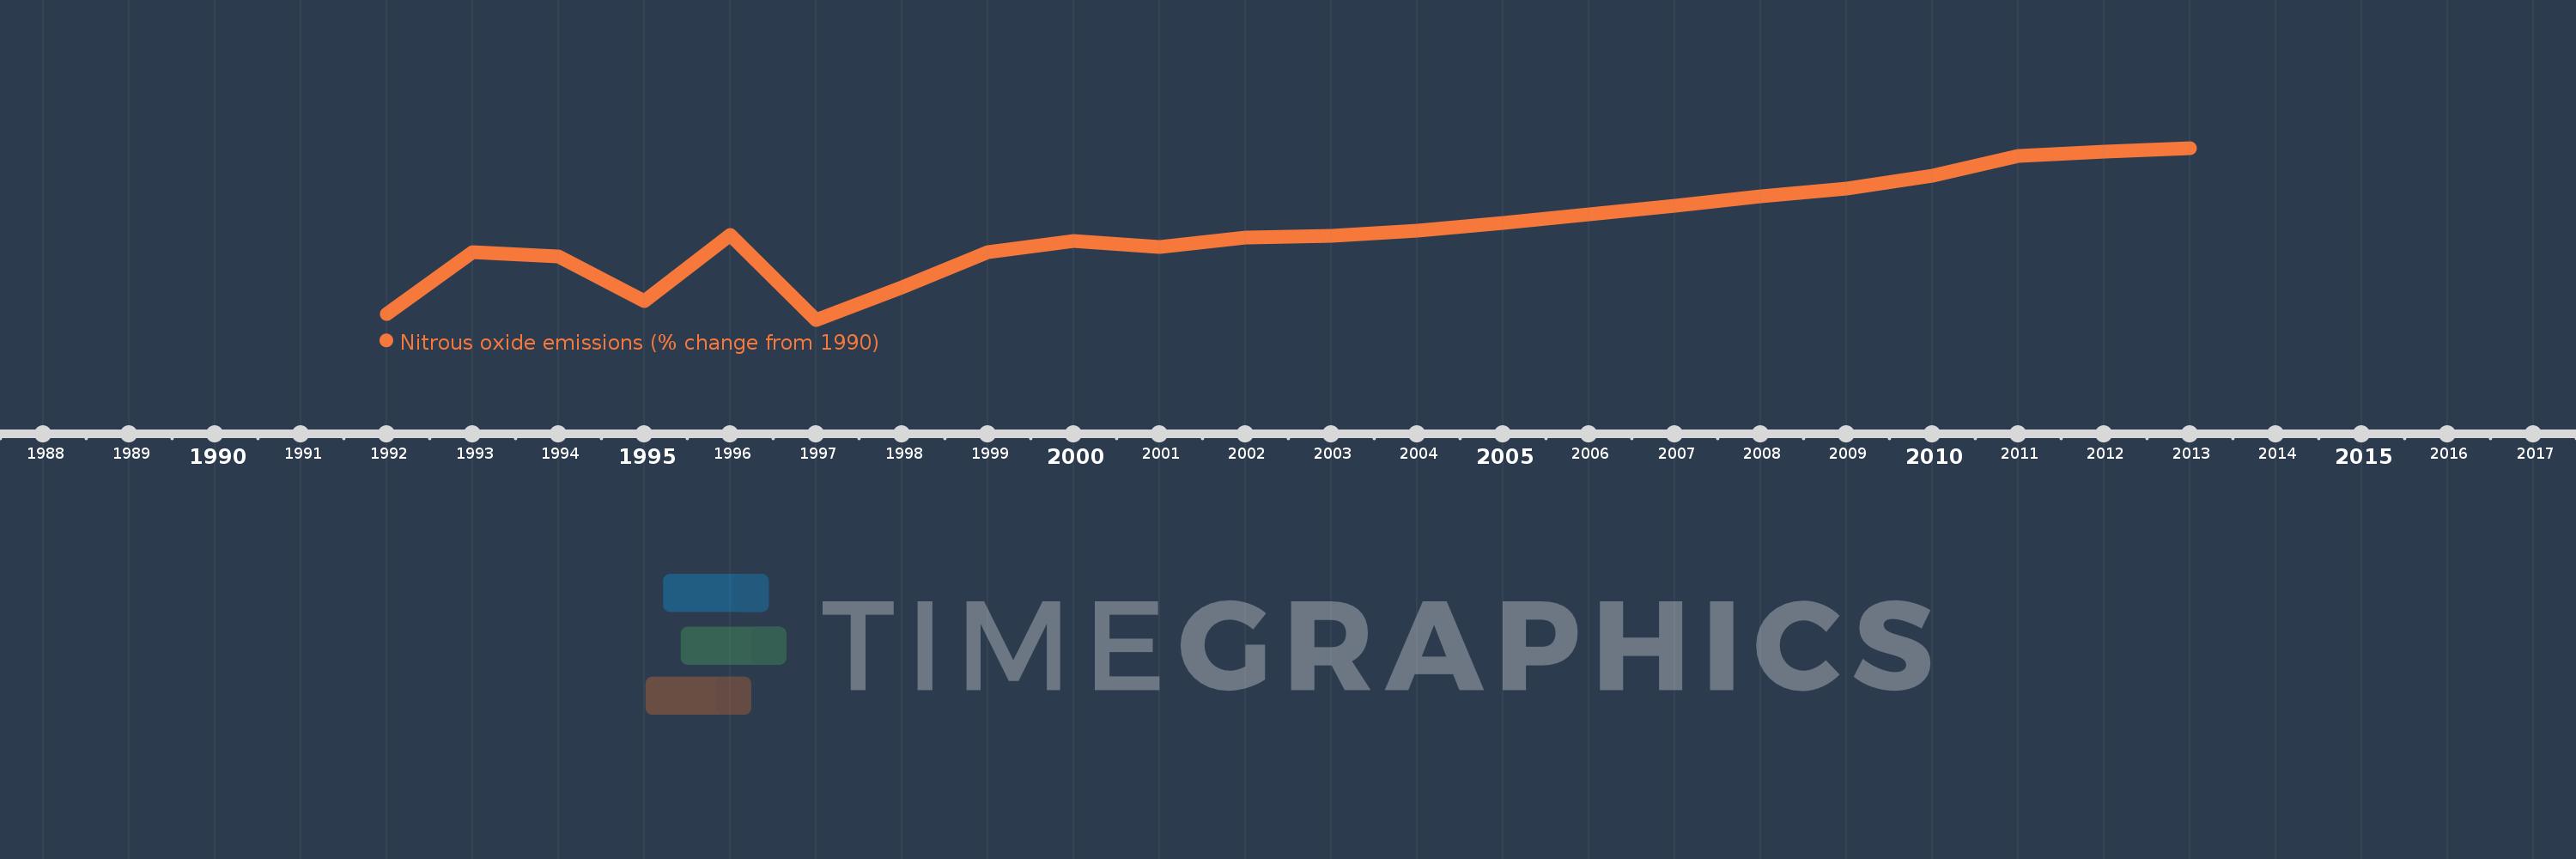
This timeline shows a graph from 1992 to 2013 of Cabo Verde. No data until 1991. Number of actual observations by date: 22.
Source name:
World Development Indicators
Source organization:
World Bank staff estimates from original source: European Commission, Joint Research Centre (JRC)/Netherlands Environmental Assessment Agency (PBL). Emission Database for Global Atmospheric Research (EDGAR): http://edgar.jrc.ec.europa.eu/.
Categories, topics:
Climate Change, Environment
Last updated:
apr 23, 2017
Indicators value changes by year
Meaning:
46.258
Minimum:
4.284
jan 1, 1997
Maximum:
84.95
jan 1, 2013
At the date of observation
Value
Absolute change
Change from the previous value
jan 1, 1992
6.899
+6.899
0.0%
jan 1, 1993
36.174
+29.275
424.34%
jan 1, 1994
34.099
-2.076
-5.74%
jan 1, 1995
13.164
-20.935
-61.39%
jan 1, 1996
43.987
+30.823
234.15%
jan 1, 1997
4.284
-39.703
-90.26%
jan 1, 1998
19.321
+15.037
350.98%
jan 1, 1999
36.028
+16.707
86.47%
jan 1, 2000
41.309
+5.281
14.66%
jan 1, 2001
38.431
-2.878
-6.97%
jan 1, 2002
42.996
+4.565
11.88%
jan 1, 2003
43.686
+0.69
1.61%
jan 1, 2004
46.211
+2.525
5.78%
jan 1, 2005
49.761
+3.55
7.68%
jan 1, 2006
53.946
+4.185
8.41%
jan 1, 2007
57.929
+3.983
7.38%
jan 1, 2008
62.191
+4.262
7.36%
jan 1, 2009
65.966
+3.775
6.07%
jan 1, 2010
71.89
+5.924
8.98%
jan 1, 2011
81.324
+9.434
13.12%
jan 1, 2012
83.137
+1.813
2.23%
jan 1, 2013
84.95
+1.813
2.18%
Ranking of countries by current statistics by years