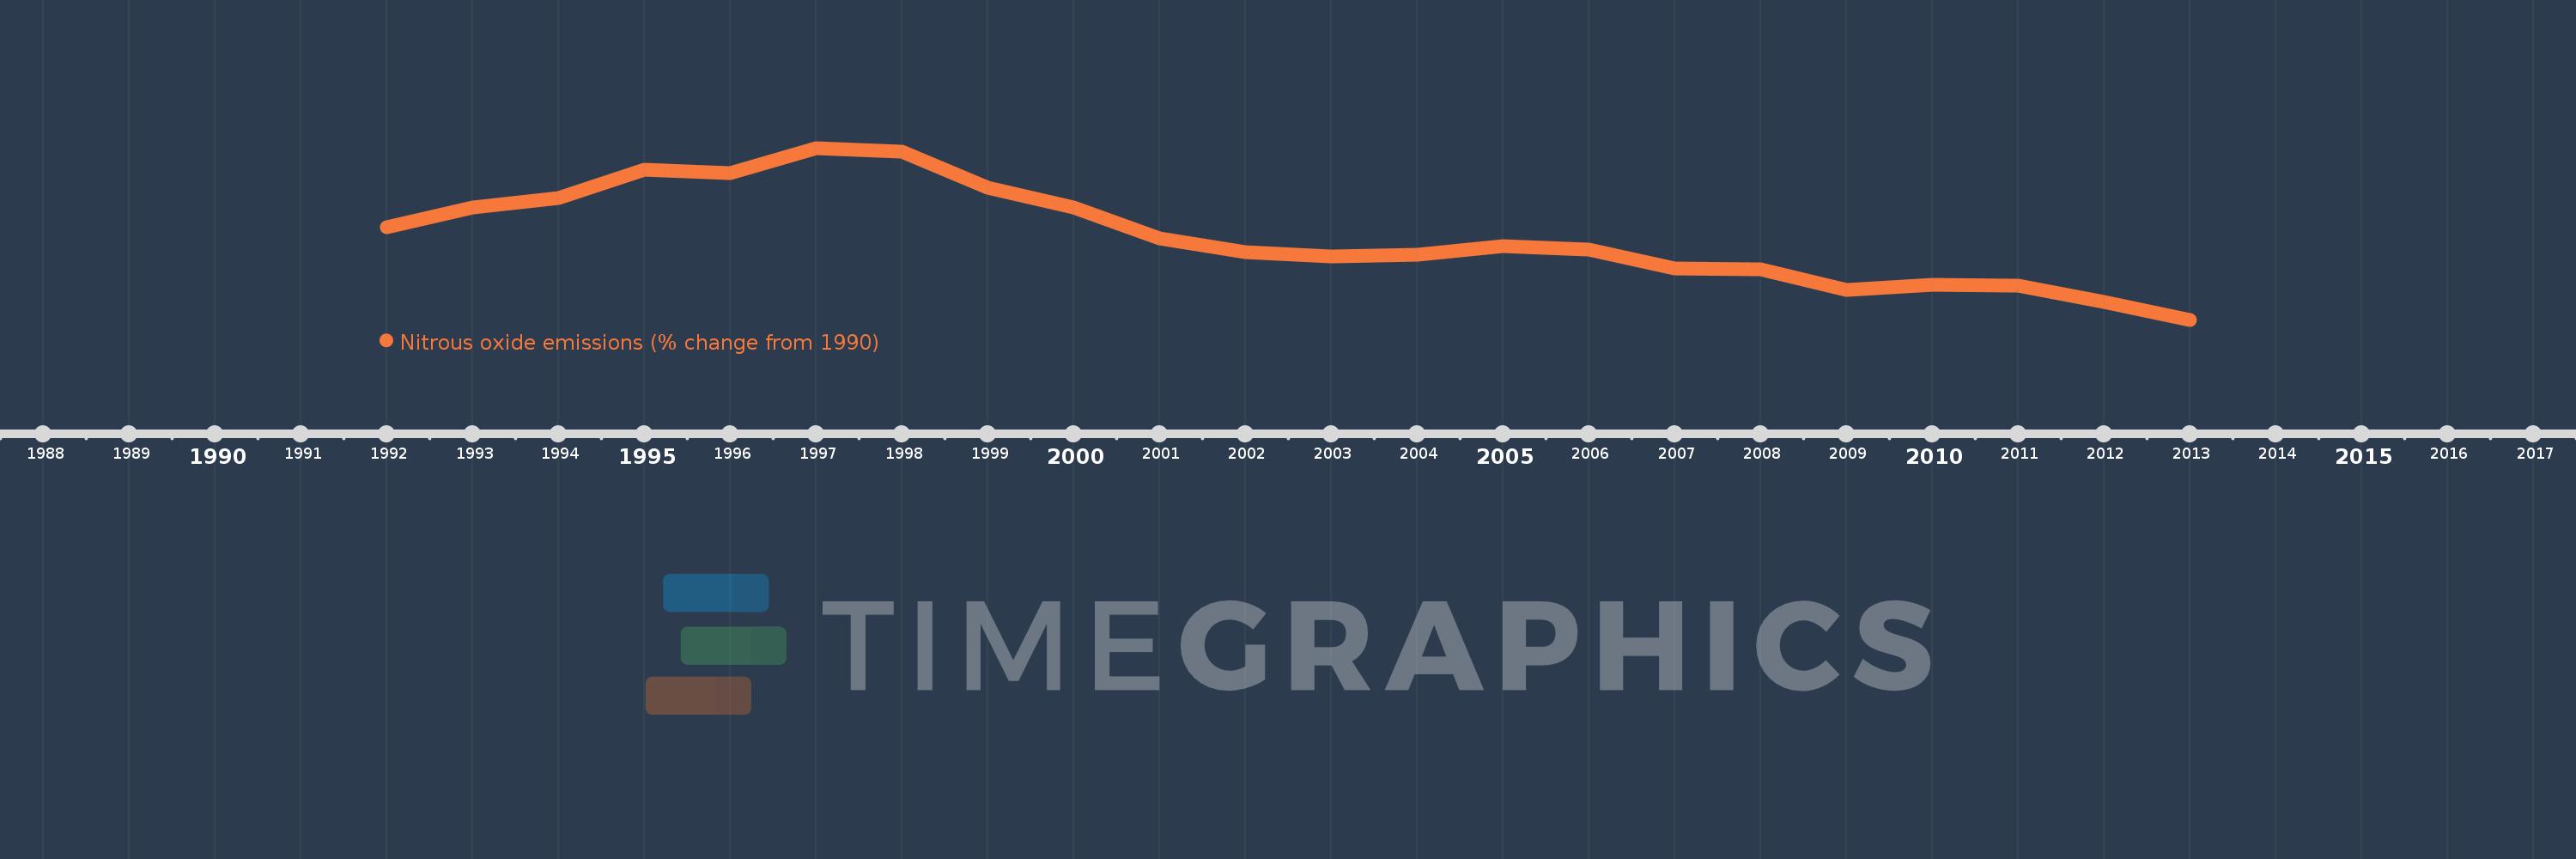
This timeline shows a graph from 1992 to 2013 of United States. No data until 1991. Number of actual observations by date: 22.
Source name:
World Development Indicators
Source organization:
World Bank staff estimates from original source: European Commission, Joint Research Centre (JRC)/Netherlands Environmental Assessment Agency (PBL). Emission Database for Global Atmospheric Research (EDGAR): http://edgar.jrc.ec.europa.eu/.
Categories, topics:
Climate Change, Environment
Last updated:
apr 23, 2017
Indicators value changes by year
Meaning:
-1.582
Minimum:
-12.95
jan 1, 2013
Maximum:
10.299
jan 1, 1997
At the date of observation
Value
Absolute change
Change from the previous value
jan 1, 1992
-0.461
-0.461
0.0%
jan 1, 1993
2.188
+2.648
-575.05%
jan 1, 1994
3.568
+1.381
63.11%
jan 1, 1995
7.365
+3.796
106.39%
jan 1, 1996
6.929
-0.436
-5.92%
jan 1, 1997
10.299
+3.37
48.65%
jan 1, 1998
9.819
-0.48
-4.66%
jan 1, 1999
4.921
-4.898
-49.88%
jan 1, 2000
2.259
-2.662
-54.1%
jan 1, 2001
-1.914
-4.173
-184.74%
jan 1, 2002
-3.768
-1.854
96.88%
jan 1, 2003
-4.329
-0.56
14.87%
jan 1, 2004
-4.17
+0.159
-3.67%
jan 1, 2005
-3.012
+1.158
-27.78%
jan 1, 2006
-3.452
-0.44
14.61%
jan 1, 2007
-5.986
-2.534
73.42%
jan 1, 2008
-6.083
-0.097
1.62%
jan 1, 2009
-8.874
-2.79
45.87%
jan 1, 2010
-8.209
+0.664
-7.48%
jan 1, 2011
-8.368
-0.159
1.93%
jan 1, 2012
-10.58
-2.211
26.43%
jan 1, 2013
-12.95
-2.37
22.4%
Ranking of countries by current statistics by years