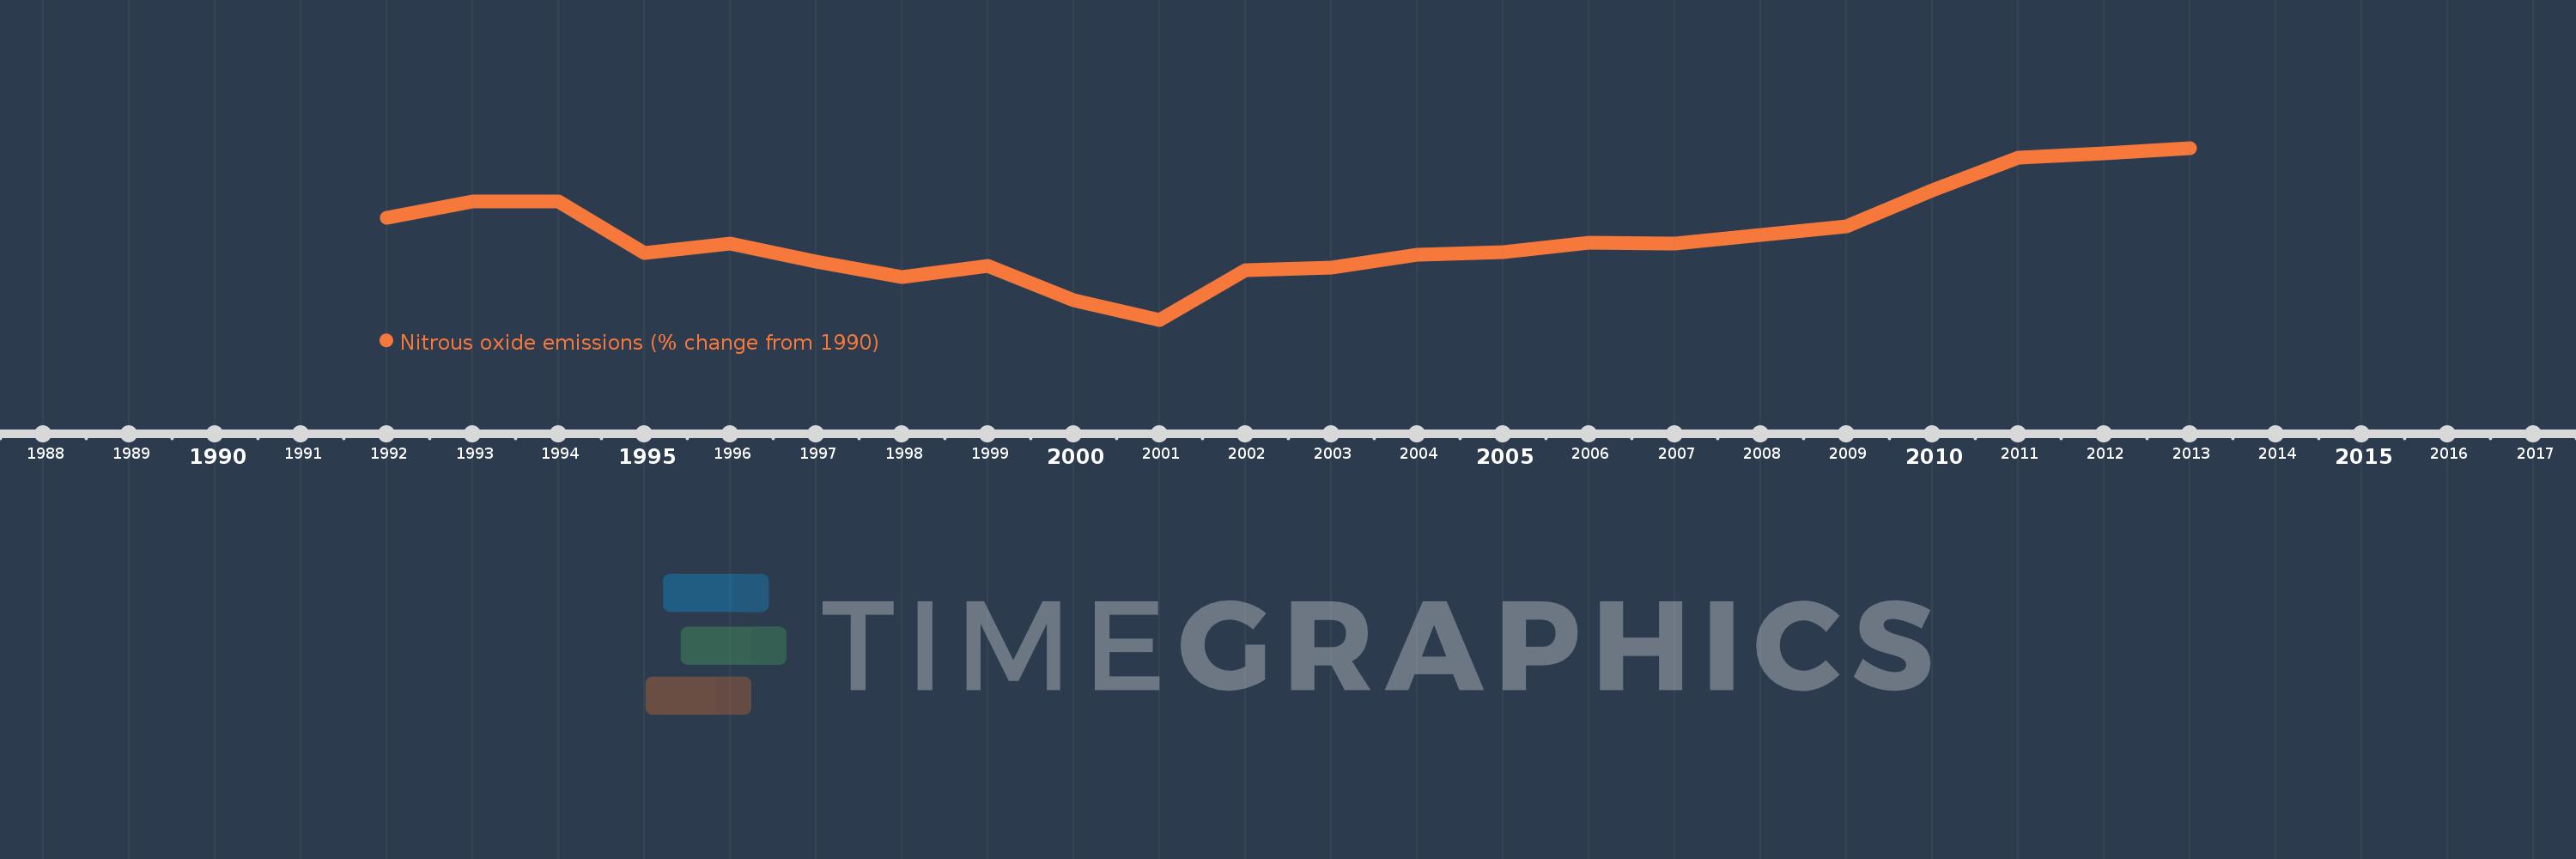
This timeline shows a graph from 1992 to 2013 of Burundi. No data until 1991. Number of actual observations by date: 22.
Source name:
World Development Indicators
Source organization:
World Bank staff estimates from original source: European Commission, Joint Research Centre (JRC)/Netherlands Environmental Assessment Agency (PBL). Emission Database for Global Atmospheric Research (EDGAR): http://edgar.jrc.ec.europa.eu/.
Categories, topics:
Climate Change, Environment
Last updated:
apr 23, 2017
Indicators value changes by year
Meaning:
-2.7
Minimum:
-21.912
jan 1, 2001
Maximum:
17.347
jan 1, 2013
At the date of observation
Value
Absolute change
Change from the previous value
jan 1, 1992
1.37
+1.37
0.0%
jan 1, 1993
5.128
+3.758
274.21%
jan 1, 1994
5.101
-0.027
-0.53%
jan 1, 1995
-6.709
-11.81
-231.54%
jan 1, 1996
-4.482
+2.227
-33.19%
jan 1, 1997
-8.713
-4.231
94.39%
jan 1, 1998
-12.172
-3.459
39.7%
jan 1, 1999
-9.602
+2.571
-21.12%
jan 1, 2000
-17.51
-7.908
82.36%
jan 1, 2001
-21.912
-4.402
25.14%
jan 1, 2002
-10.599
+11.312
-51.63%
jan 1, 2003
-10.033
+0.566
-5.34%
jan 1, 2004
-7.145
+2.888
-28.78%
jan 1, 2005
-6.482
+0.663
-9.28%
jan 1, 2006
-4.307
+2.175
-33.55%
jan 1, 2007
-4.514
-0.207
4.8%
jan 1, 2008
-2.569
+1.945
-43.08%
jan 1, 2009
-0.485
+2.084
-81.12%
jan 1, 2010
7.651
+8.136
-1.68K%
jan 1, 2011
15.046
+7.395
96.66%
jan 1, 2012
16.196
+1.15
7.65%
jan 1, 2013
17.347
+1.15
7.1%
Ranking of countries by current statistics by years