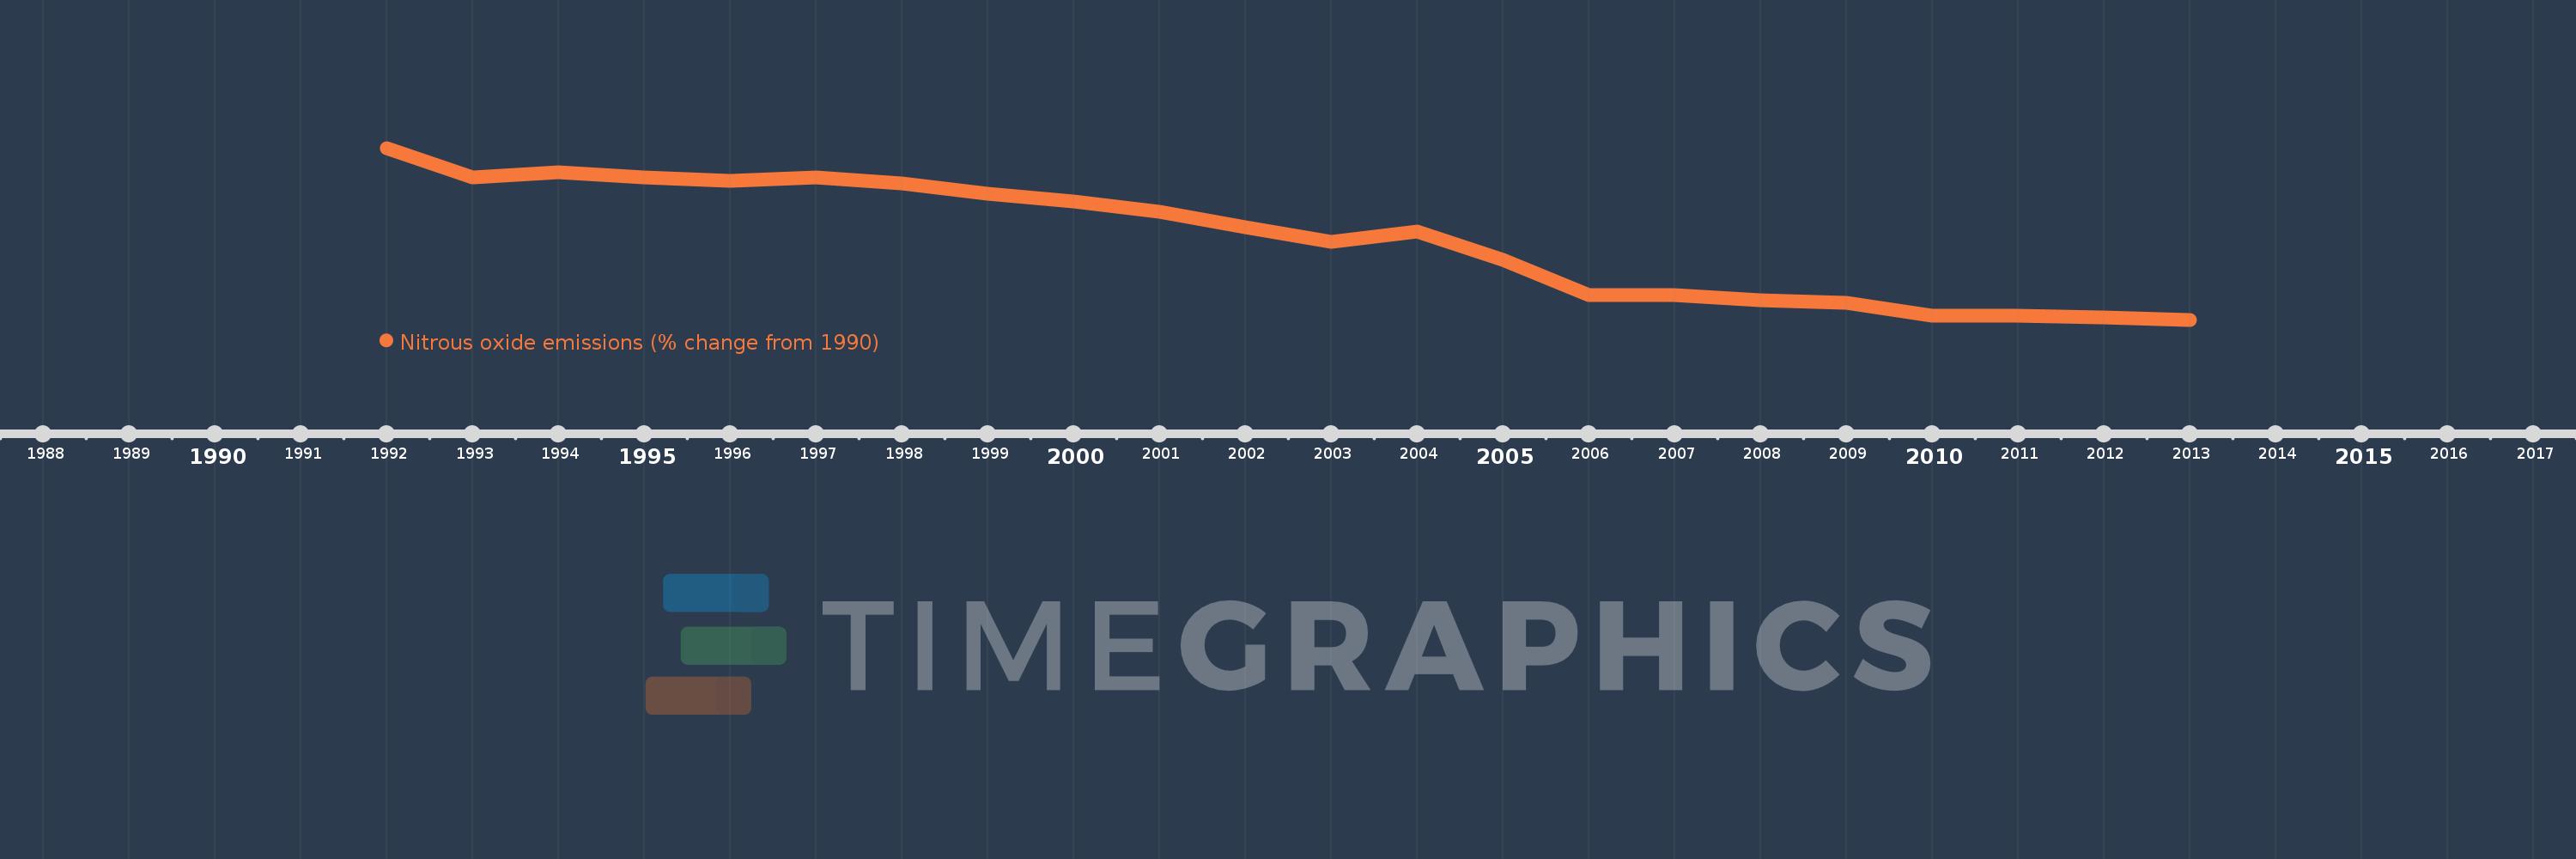
This timeline shows a graph from 1992 to 2013 of Denmark. No data until 1991. Number of actual observations by date: 22.
Source name:
World Development Indicators
Source organization:
World Bank staff estimates from original source: European Commission, Joint Research Centre (JRC)/Netherlands Environmental Assessment Agency (PBL). Emission Database for Global Atmospheric Research (EDGAR): http://edgar.jrc.ec.europa.eu/.
Categories, topics:
Climate Change, Environment
Last updated:
apr 23, 2017
Indicators value changes by year
Meaning:
-19.692
Minimum:
-35.582
jan 1, 2013
Maximum:
-2.005
jan 1, 1992
At the date of observation
Value
Absolute change
Change from the previous value
jan 1, 1992
-2.005
-2.005
0.0%
jan 1, 1993
-7.788
-5.783
288.36%
jan 1, 1994
-6.683
+1.106
-14.2%
jan 1, 1995
-7.694
-1.011
15.13%
jan 1, 1996
-8.376
-0.682
8.87%
jan 1, 1997
-7.787
+0.589
-7.04%
jan 1, 1998
-8.951
-1.164
14.95%
jan 1, 1999
-10.999
-2.048
22.88%
jan 1, 2000
-12.508
-1.51
13.72%
jan 1, 2001
-14.419
-1.911
15.28%
jan 1, 2002
-17.528
-3.109
21.56%
jan 1, 2003
-20.388
-2.86
16.32%
jan 1, 2004
-18.275
+2.113
-10.36%
jan 1, 2005
-23.889
-5.615
30.72%
jan 1, 2006
-30.764
-6.875
28.78%
jan 1, 2007
-30.816
-0.052
0.17%
jan 1, 2008
-31.846
-1.03
3.34%
jan 1, 2009
-32.26
-0.414
1.3%
jan 1, 2010
-34.76
-2.499
7.75%
jan 1, 2011
-34.743
+0.017
-0.05%
jan 1, 2012
-35.171
-0.428
1.23%
jan 1, 2013
-35.582
-0.411
1.17%
Ranking of countries by current statistics by years