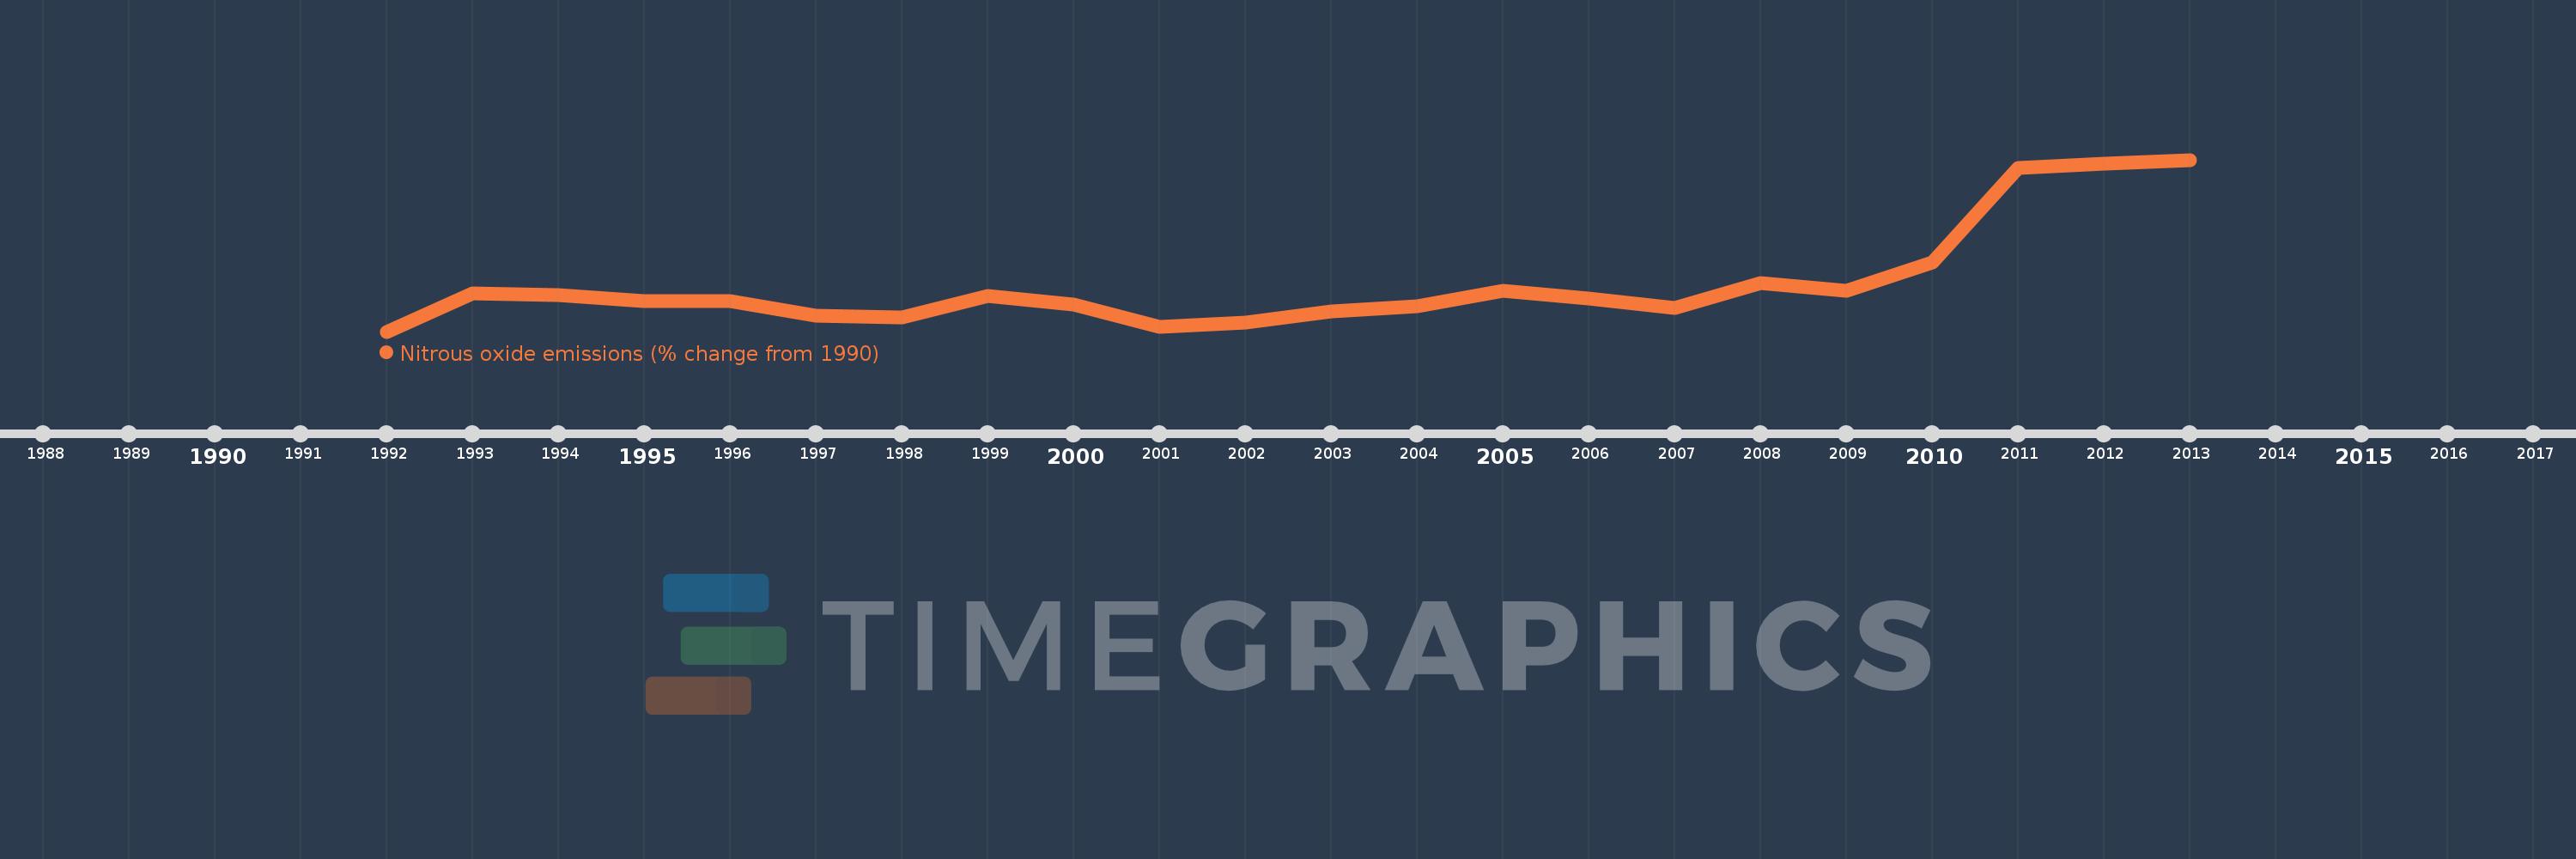
This timeline shows a graph from 1992 to 2013 of Thailand. No data until 1991. Number of actual observations by date: 22.
Source name:
World Development Indicators
Source organization:
World Bank staff estimates from original source: European Commission, Joint Research Centre (JRC)/Netherlands Environmental Assessment Agency (PBL). Emission Database for Global Atmospheric Research (EDGAR): http://edgar.jrc.ec.europa.eu/.
Categories, topics:
Climate Change, Environment
Last updated:
apr 23, 2017
Indicators value changes by year
Meaning:
18.504
Minimum:
-0.291
jan 1, 1992
Maximum:
67.52
jan 1, 2013
At the date of observation
Value
Absolute change
Change from the previous value
jan 1, 1992
-0.291
-0.291
0.0%
jan 1, 1993
14.688
+14.978
-5.16K%
jan 1, 1994
14.213
-0.474
-3.23%
jan 1, 1995
11.75
-2.463
-17.33%
jan 1, 1996
11.594
-0.156
-1.33%
jan 1, 1997
6.091
-5.503
-47.47%
jan 1, 1998
5.357
-0.734
-12.05%
jan 1, 1999
13.909
+8.552
159.64%
jan 1, 2000
10.511
-3.398
-24.43%
jan 1, 2001
1.476
-9.035
-85.96%
jan 1, 2002
3.334
+1.858
125.88%
jan 1, 2003
7.841
+4.507
135.18%
jan 1, 2004
9.65
+1.809
23.07%
jan 1, 2005
15.825
+6.176
64.0%
jan 1, 2006
12.774
-3.051
-19.28%
jan 1, 2007
9.013
-3.761
-29.44%
jan 1, 2008
18.883
+9.87
109.51%
jan 1, 2009
15.714
-3.169
-16.78%
jan 1, 2010
27.126
+11.413
72.63%
jan 1, 2011
64.235
+37.109
136.8%
jan 1, 2012
65.877
+1.642
2.56%
jan 1, 2013
67.52
+1.642
2.49%
Ranking of countries by current statistics by years