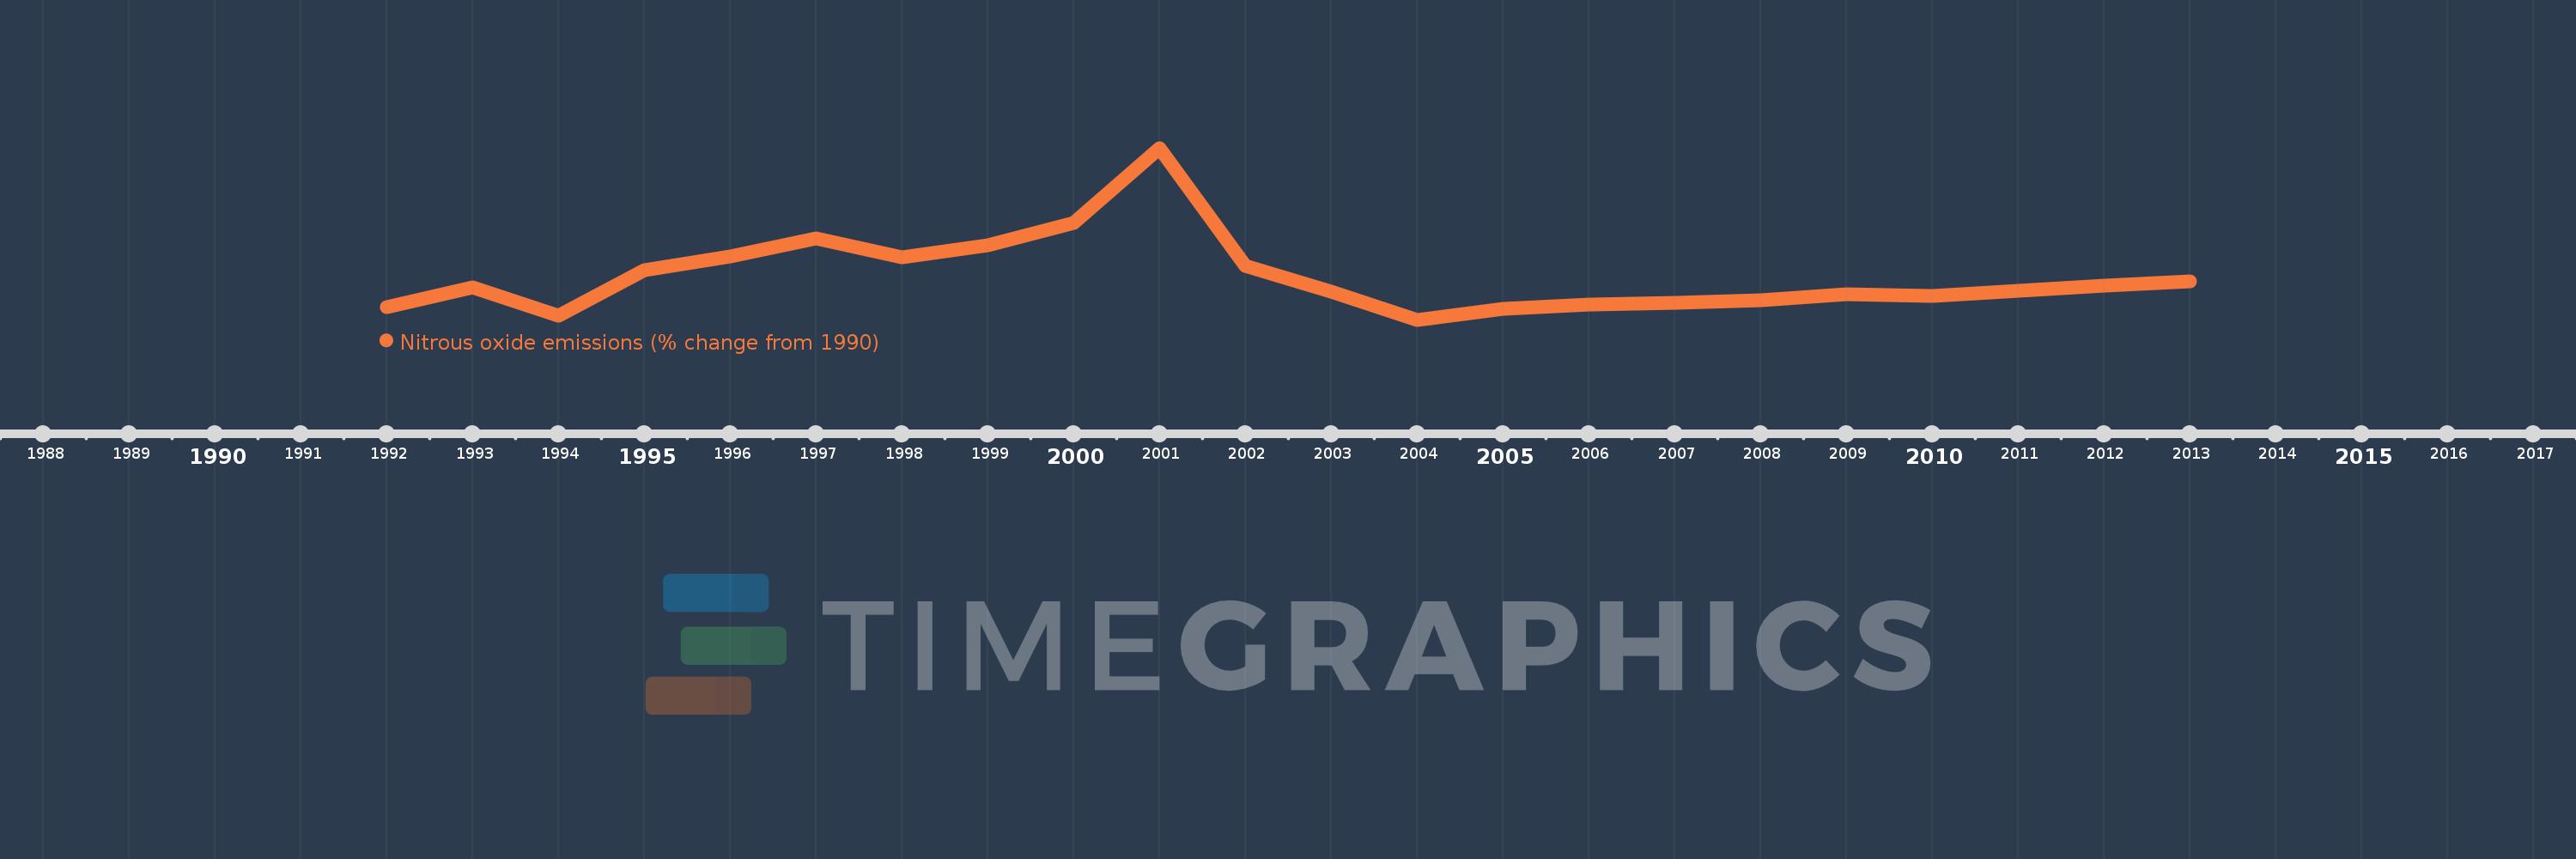
This timeline shows a graph from 1992 to 2013 of Mauritius. No data until 1991. Number of actual observations by date: 22.
Source name:
World Development Indicators
Source organization:
World Bank staff estimates from original source: European Commission, Joint Research Centre (JRC)/Netherlands Environmental Assessment Agency (PBL). Emission Database for Global Atmospheric Research (EDGAR): http://edgar.jrc.ec.europa.eu/.
Categories, topics:
Climate Change, Environment
Last updated:
apr 23, 2017
Indicators value changes by year
Meaning:
6.715
Minimum:
-3.468
jan 1, 2004
Maximum:
37.251
jan 1, 2001
At the date of observation
Value
Absolute change
Change from the previous value
jan 1, 1992
-0.403
-0.403
0.0%
jan 1, 1993
4.224
+4.627
-1.15K%
jan 1, 1994
-2.459
-6.682
-158.21%
jan 1, 1995
8.352
+10.811
-439.72%
jan 1, 1996
11.589
+3.236
38.75%
jan 1, 1997
15.888
+4.299
37.1%
jan 1, 1998
11.426
-4.461
-28.08%
jan 1, 1999
14.254
+2.827
24.74%
jan 1, 2000
19.502
+5.249
36.83%
jan 1, 2001
37.251
+17.748
91.01%
jan 1, 2002
9.215
-28.035
-75.26%
jan 1, 2003
3.161
-6.054
-65.69%
jan 1, 2004
-3.468
-6.63
-209.7%
jan 1, 2005
-0.913
+2.555
-73.68%
jan 1, 2006
0.158
+1.071
-117.32%
jan 1, 2007
0.516
+0.358
226.37%
jan 1, 2008
1.12
+0.604
117.01%
jan 1, 2009
2.644
+1.524
136.15%
jan 1, 2010
2.111
-0.533
-20.15%
jan 1, 2011
3.489
+1.377
65.24%
jan 1, 2012
4.523
+1.035
29.66%
jan 1, 2013
5.558
+1.035
22.88%
Ranking of countries by current statistics by years