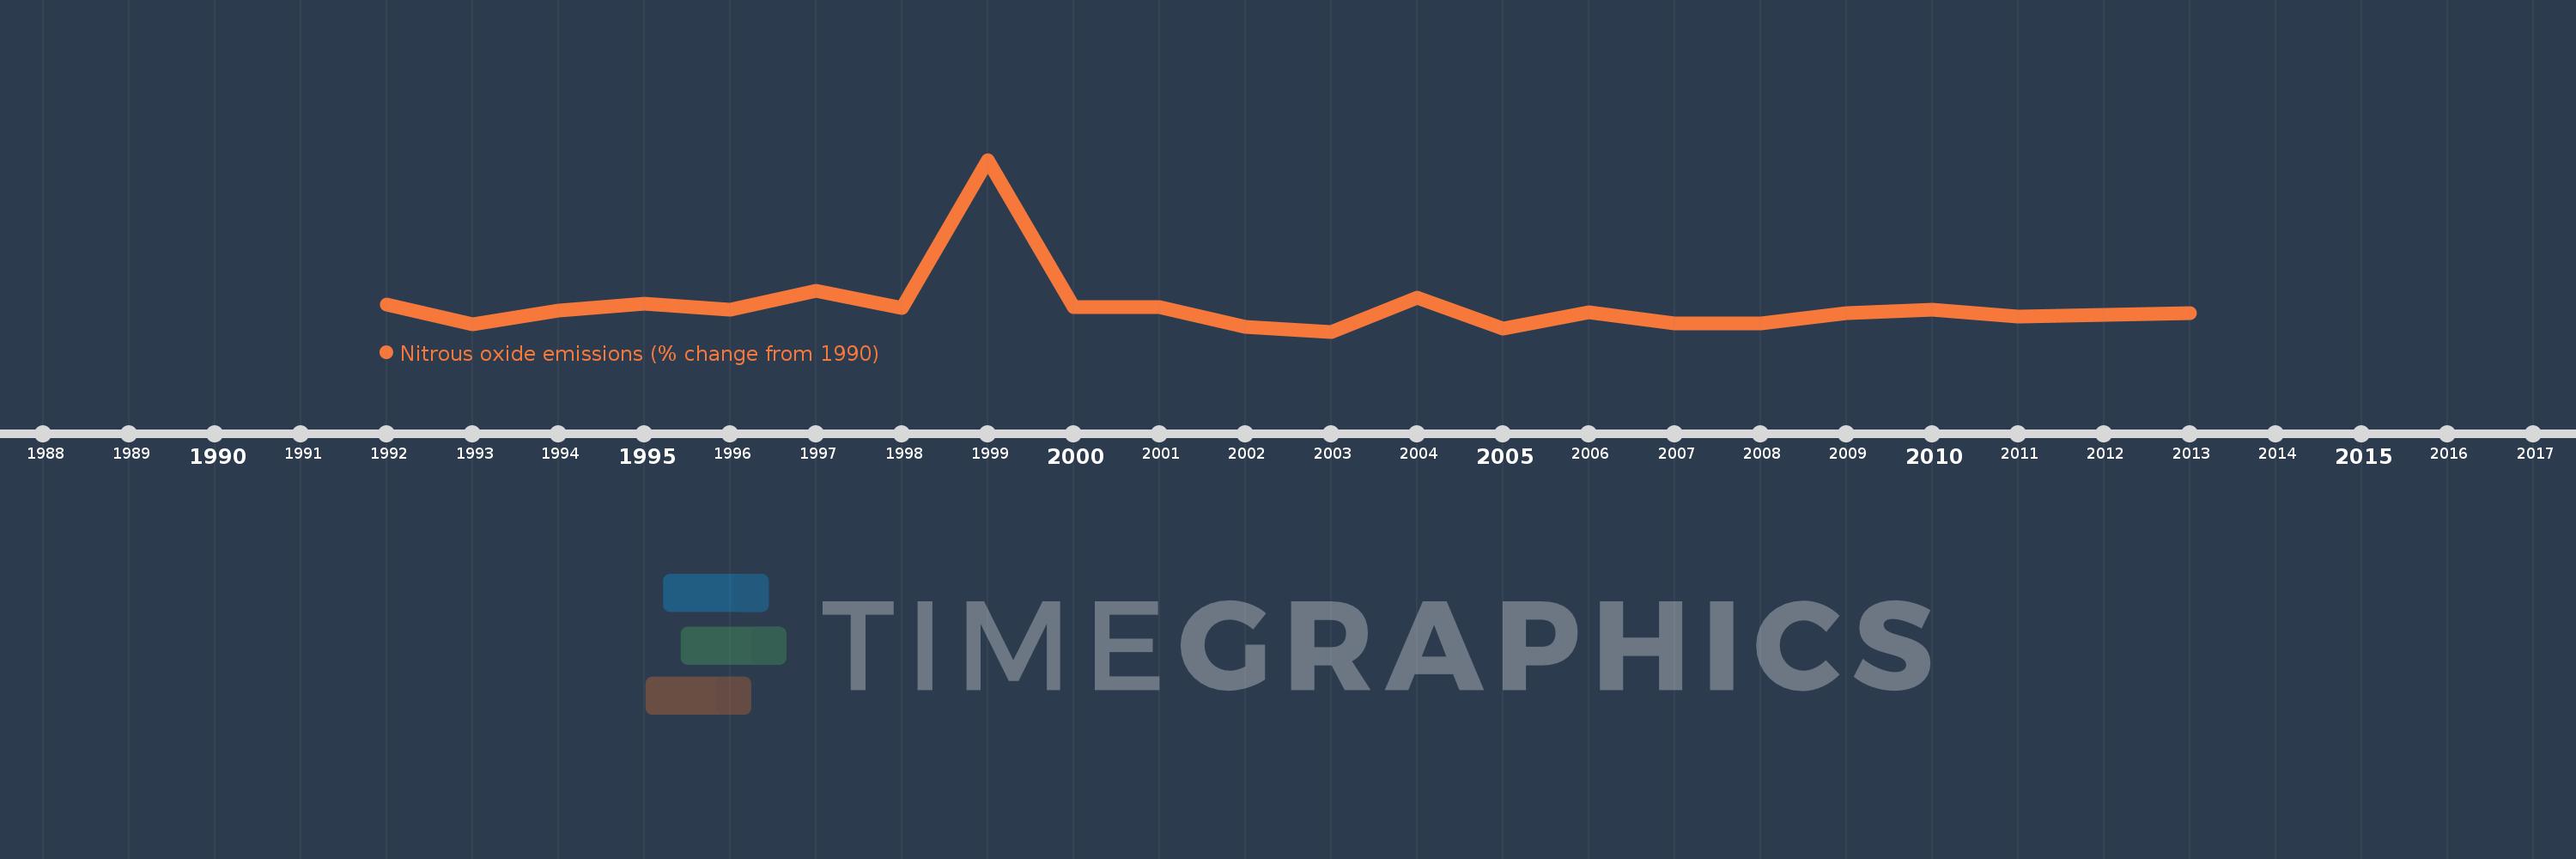
This timeline shows a graph from 1992 to 2013 of Mexico. No data until 1991. Number of actual observations by date: 22.
Source name:
World Development Indicators
Source organization:
World Bank staff estimates from original source: European Commission, Joint Research Centre (JRC)/Netherlands Environmental Assessment Agency (PBL). Emission Database for Global Atmospheric Research (EDGAR): http://edgar.jrc.ec.europa.eu/.
Categories, topics:
Climate Change, Environment
Last updated:
apr 23, 2017
Indicators value changes by year
Meaning:
-1.421
Minimum:
-6.849
jan 1, 2003
Maximum:
29.942
jan 1, 1999
At the date of observation
Value
Absolute change
Change from the previous value
jan 1, 1992
-1.135
-1.135
0.0%
jan 1, 1993
-5.363
-4.229
372.69%
jan 1, 1994
-2.35
+3.013
-56.18%
jan 1, 1995
-0.907
+1.444
-61.43%
jan 1, 1996
-2.193
-1.286
141.9%
jan 1, 1997
1.834
+4.027
-183.63%
jan 1, 1998
-1.709
-3.542
-193.16%
jan 1, 1999
29.942
+31.651
-1.85K%
jan 1, 2000
-1.562
-31.504
-105.22%
jan 1, 2001
-1.633
-0.071
4.53%
jan 1, 2002
-5.871
-4.238
259.51%
jan 1, 2003
-6.849
-0.979
16.67%
jan 1, 2004
0.377
+7.226
-105.5%
jan 1, 2005
-6.184
-6.561
-1.74K%
jan 1, 2006
-2.749
+3.435
-55.55%
jan 1, 2007
-5.13
-2.381
86.61%
jan 1, 2008
-5.151
-0.021
0.42%
jan 1, 2009
-2.829
+2.322
-45.08%
jan 1, 2010
-2.127
+0.702
-24.82%
jan 1, 2011
-3.559
-1.432
67.32%
jan 1, 2012
-3.222
+0.338
-9.48%
jan 1, 2013
-2.884
+0.338
-10.48%
Ranking of countries by current statistics by years