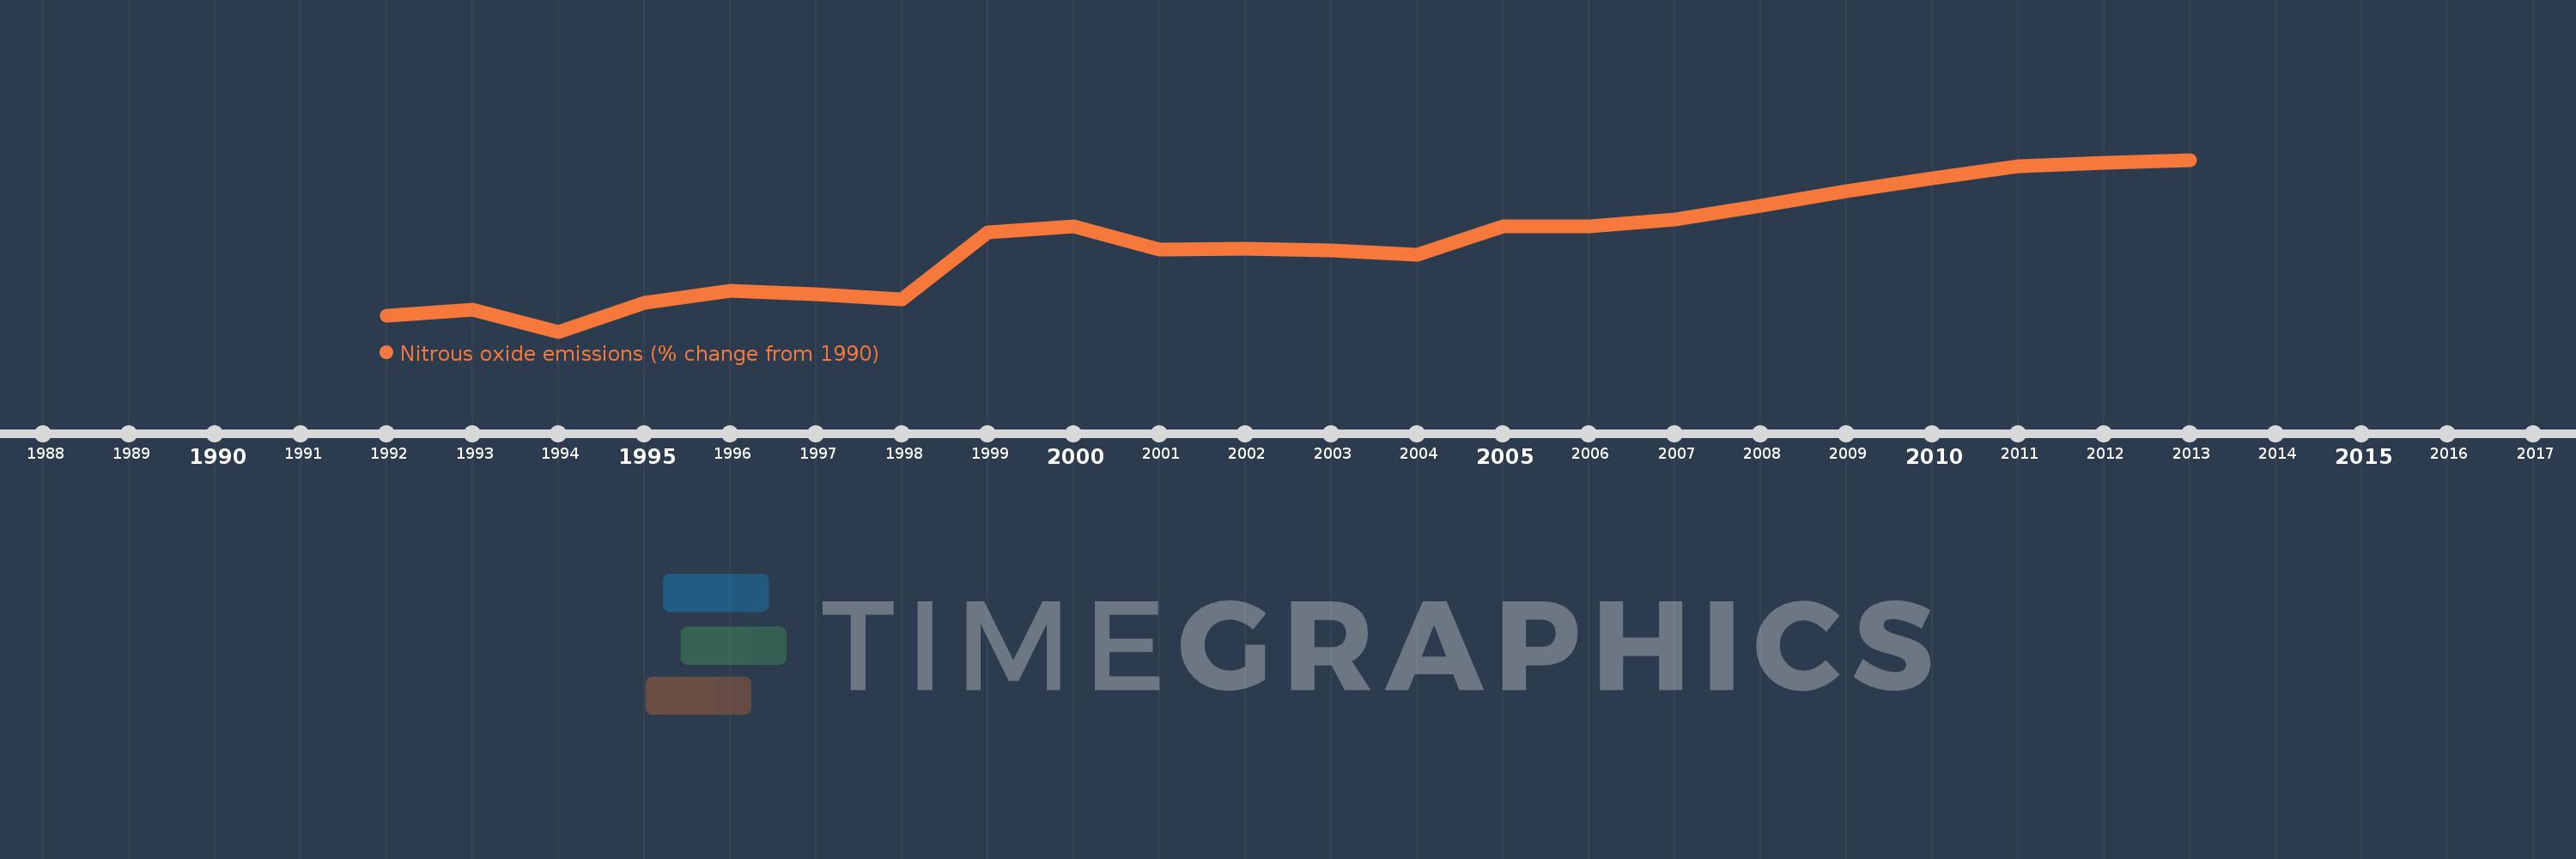
This timeline shows a graph from 1992 to 2013 of Cayman Islands. No data until 1991. Number of actual observations by date: 22.
Source name:
World Development Indicators
Source organization:
World Bank staff estimates from original source: European Commission, Joint Research Centre (JRC)/Netherlands Environmental Assessment Agency (PBL). Emission Database for Global Atmospheric Research (EDGAR): http://edgar.jrc.ec.europa.eu/.
Categories, topics:
Climate Change, Environment
Last updated:
apr 23, 2017
Indicators value changes by year
Meaning:
50.822
Minimum:
-1.965
jan 1, 1994
Maximum:
100.168
jan 1, 2013
At the date of observation
Value
Absolute change
Change from the previous value
jan 1, 1992
7.596
+7.596
0.0%
jan 1, 1993
11.035
+3.44
45.29%
jan 1, 1994
-1.965
-13.0
-117.81%
jan 1, 1995
15.145
+17.11
-870.78%
jan 1, 1996
22.498
+7.353
48.55%
jan 1, 1997
20.267
-2.231
-9.92%
jan 1, 1998
17.19
-3.077
-15.18%
jan 1, 1999
57.09
+39.9
232.11%
jan 1, 2000
60.791
+3.701
6.48%
jan 1, 2001
46.842
-13.949
-22.95%
jan 1, 2002
47.457
+0.615
1.31%
jan 1, 2003
46.182
-1.274
-2.69%
jan 1, 2004
43.823
-2.359
-5.11%
jan 1, 2005
60.588
+16.764
38.25%
jan 1, 2006
60.772
+0.185
0.31%
jan 1, 2007
64.744
+3.971
6.53%
jan 1, 2008
72.647
+7.903
12.21%
jan 1, 2009
81.418
+8.772
12.07%
jan 1, 2010
89.35
+7.932
9.74%
jan 1, 2011
96.243
+6.893
7.72%
jan 1, 2012
98.206
+1.962
2.04%
jan 1, 2013
100.168
+1.962
2.0%
Ranking of countries by current statistics by years