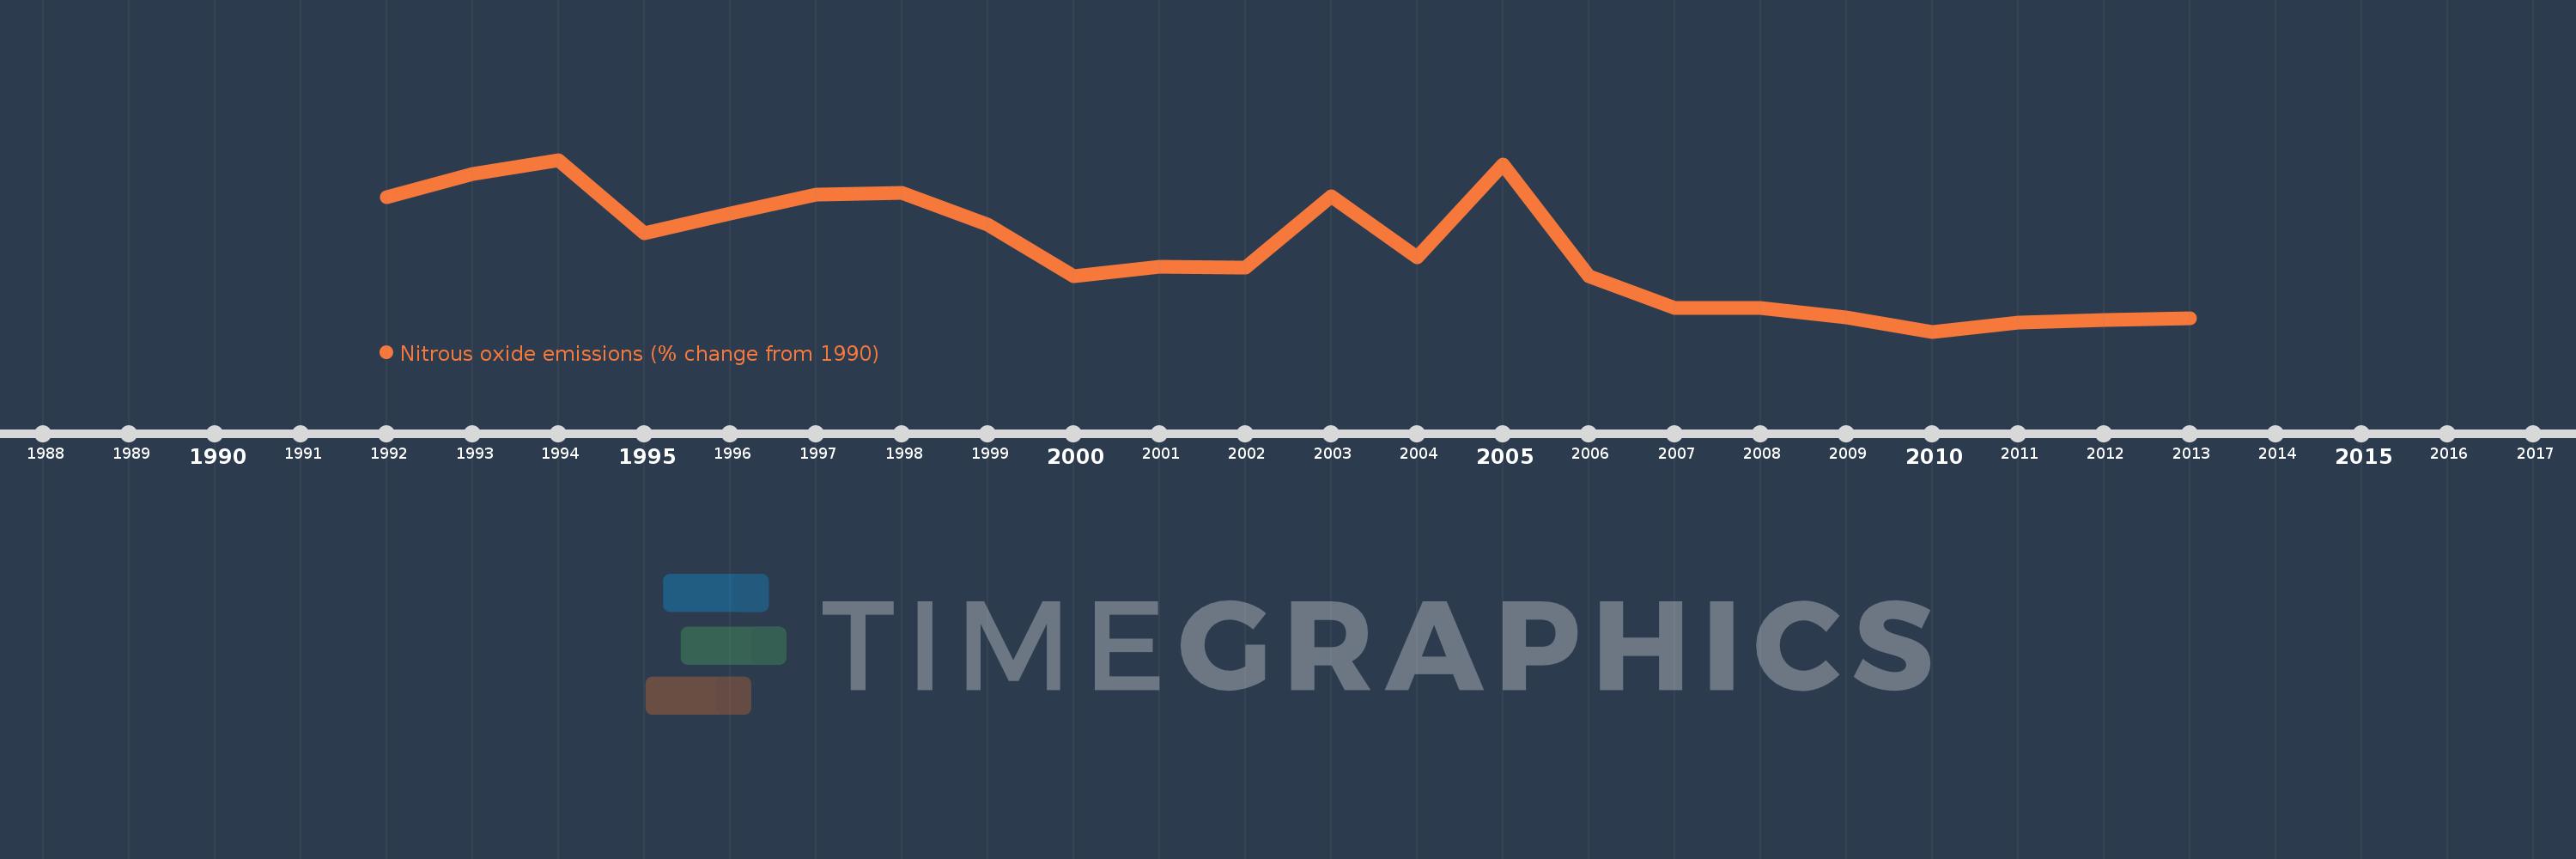
This timeline shows a graph from 1992 to 2013 of Suriname. No data until 1991. Number of actual observations by date: 22.
Source name:
World Development Indicators
Source organization:
World Bank staff estimates from original source: European Commission, Joint Research Centre (JRC)/Netherlands Environmental Assessment Agency (PBL). Emission Database for Global Atmospheric Research (EDGAR): http://edgar.jrc.ec.europa.eu/.
Categories, topics:
Climate Change, Environment
Last updated:
apr 23, 2017
Indicators value changes by year
Meaning:
-19.635
Minimum:
-43.385
jan 1, 2010
Maximum:
7.198
jan 1, 1994
At the date of observation
Value
Absolute change
Change from the previous value
jan 1, 1992
-3.839
-3.839
0.0%
jan 1, 1993
2.991
+6.83
-177.9%
jan 1, 1994
7.198
+4.207
140.68%
jan 1, 1995
-14.546
-21.745
-302.08%
jan 1, 1996
-8.531
+6.015
-41.35%
jan 1, 1997
-2.989
+5.542
-64.96%
jan 1, 1998
-2.432
+0.558
-18.65%
jan 1, 1999
-11.904
-9.472
389.5%
jan 1, 2000
-27.17
-15.266
128.24%
jan 1, 2001
-24.219
+2.951
-10.86%
jan 1, 2002
-24.46
-0.241
1.0%
jan 1, 2003
-3.613
+20.847
-85.23%
jan 1, 2004
-21.588
-17.975
497.53%
jan 1, 2005
5.908
+27.496
-127.37%
jan 1, 2006
-27.134
-33.043
-559.27%
jan 1, 2007
-36.4
-9.266
34.15%
jan 1, 2008
-36.484
-0.083
0.23%
jan 1, 2009
-39.172
-2.688
7.37%
jan 1, 2010
-43.385
-4.213
10.76%
jan 1, 2011
-40.662
+2.723
-6.28%
jan 1, 2012
-40.069
+0.593
-1.46%
jan 1, 2013
-39.475
+0.593
-1.48%
Ranking of countries by current statistics by years