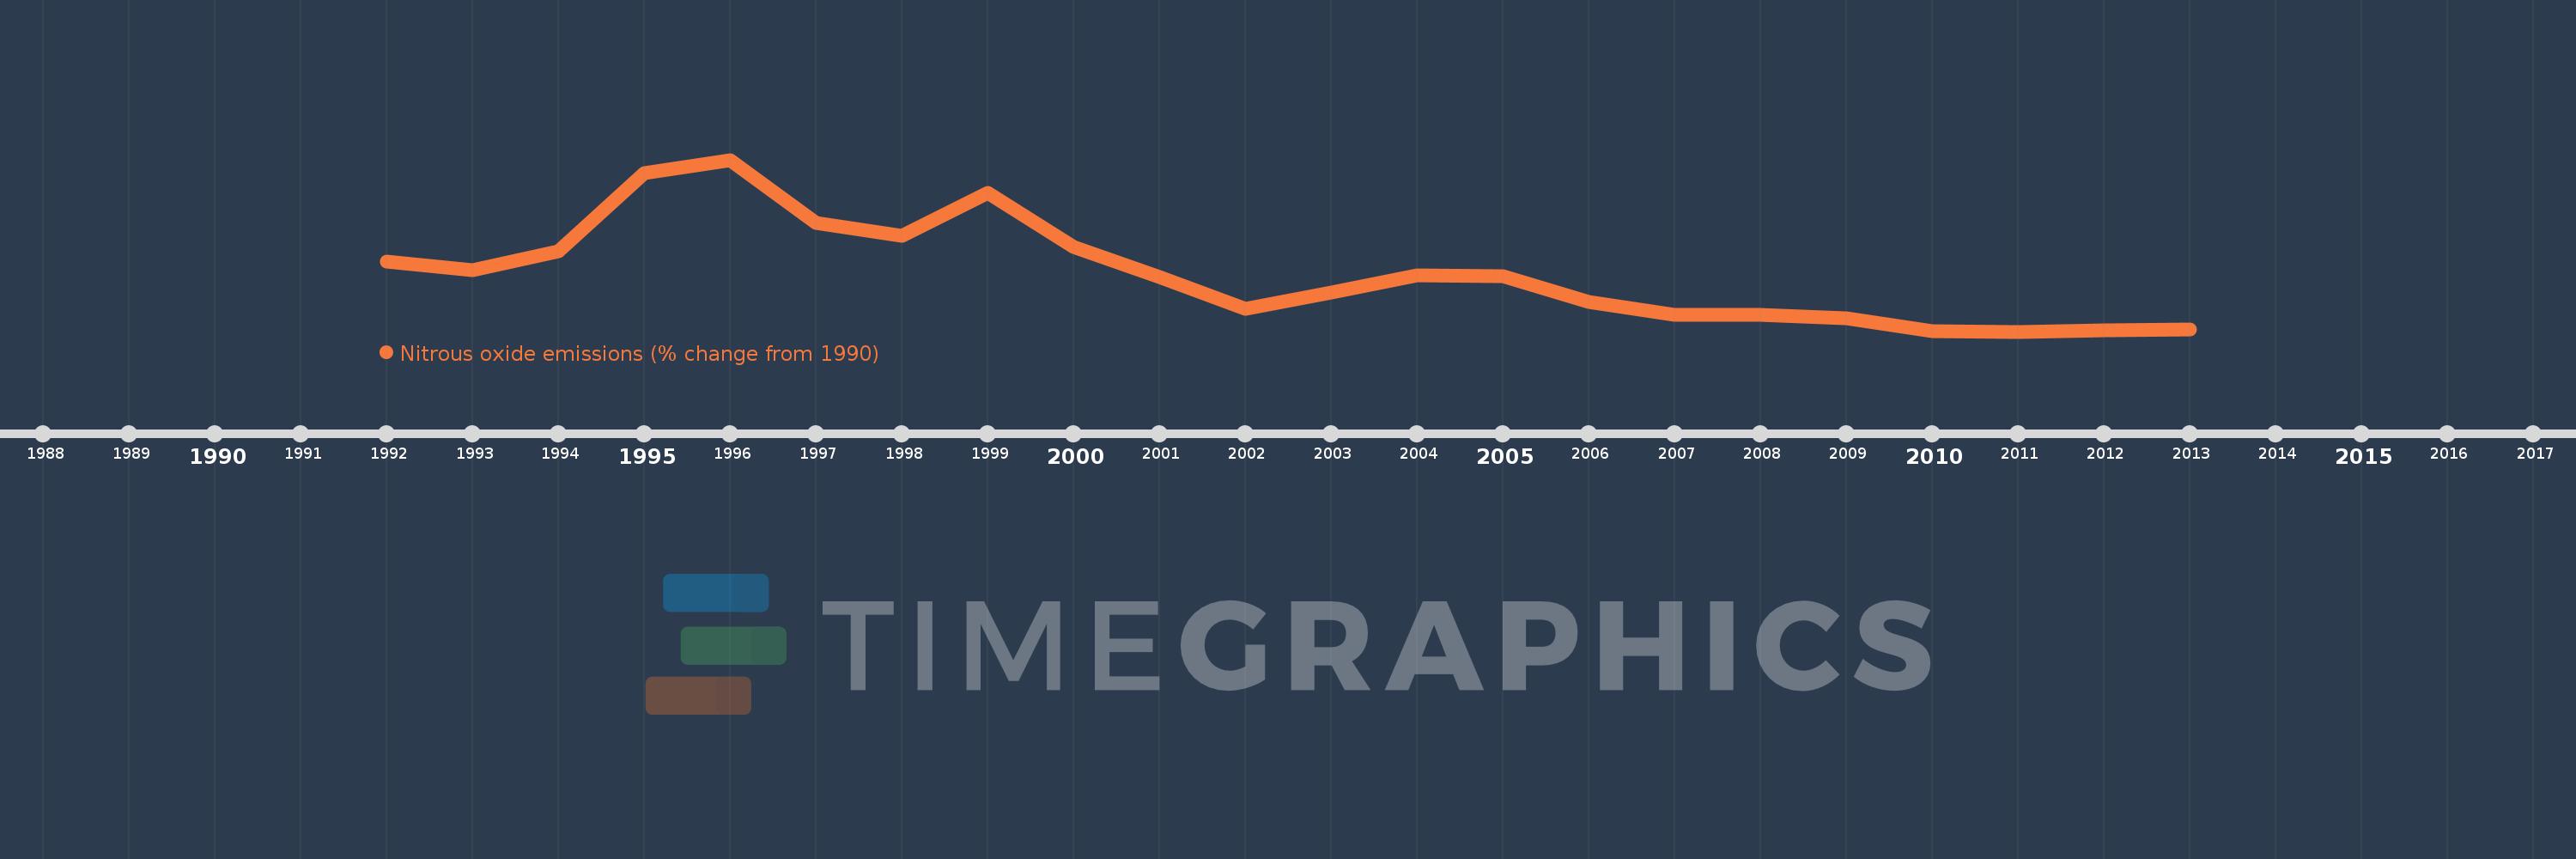
This timeline shows a graph from 1992 to 2013 of Canada. No data until 1991. Number of actual observations by date: 22.
Source name:
World Development Indicators
Source organization:
World Bank staff estimates from original source: European Commission, Joint Research Centre (JRC)/Netherlands Environmental Assessment Agency (PBL). Emission Database for Global Atmospheric Research (EDGAR): http://edgar.jrc.ec.europa.eu/.
Categories, topics:
Climate Change, Environment
Last updated:
apr 23, 2017
Indicators value changes by year
Meaning:
-0.823
Minimum:
-28.357
jan 1, 2011
Maximum:
53.181
jan 1, 1996
At the date of observation
Value
Absolute change
Change from the previous value
jan 1, 1992
4.84
+4.84
0.0%
jan 1, 1993
0.641
-4.2
-86.77%
jan 1, 1994
9.793
+9.153
1.43K%
jan 1, 1995
46.822
+37.029
378.1%
jan 1, 1996
53.181
+6.359
13.58%
jan 1, 1997
23.016
-30.166
-56.72%
jan 1, 1998
16.965
-6.051
-26.29%
jan 1, 1999
37.577
+20.612
121.5%
jan 1, 2000
11.92
-25.658
-68.28%
jan 1, 2001
-2.442
-14.362
-120.49%
jan 1, 2002
-17.698
-15.255
624.63%
jan 1, 2003
-9.934
+7.764
-43.87%
jan 1, 2004
-1.578
+8.356
-84.11%
jan 1, 2005
-2.263
-0.684
43.35%
jan 1, 2006
-14.315
-12.052
532.65%
jan 1, 2007
-20.403
-6.088
42.53%
jan 1, 2008
-20.316
+0.087
-0.43%
jan 1, 2009
-22.223
-1.907
9.39%
jan 1, 2010
-28.069
-5.846
26.31%
jan 1, 2011
-28.357
-0.288
1.03%
jan 1, 2012
-27.775
+0.582
-2.05%
jan 1, 2013
-27.481
+0.294
-1.06%
Ranking of countries by current statistics by years