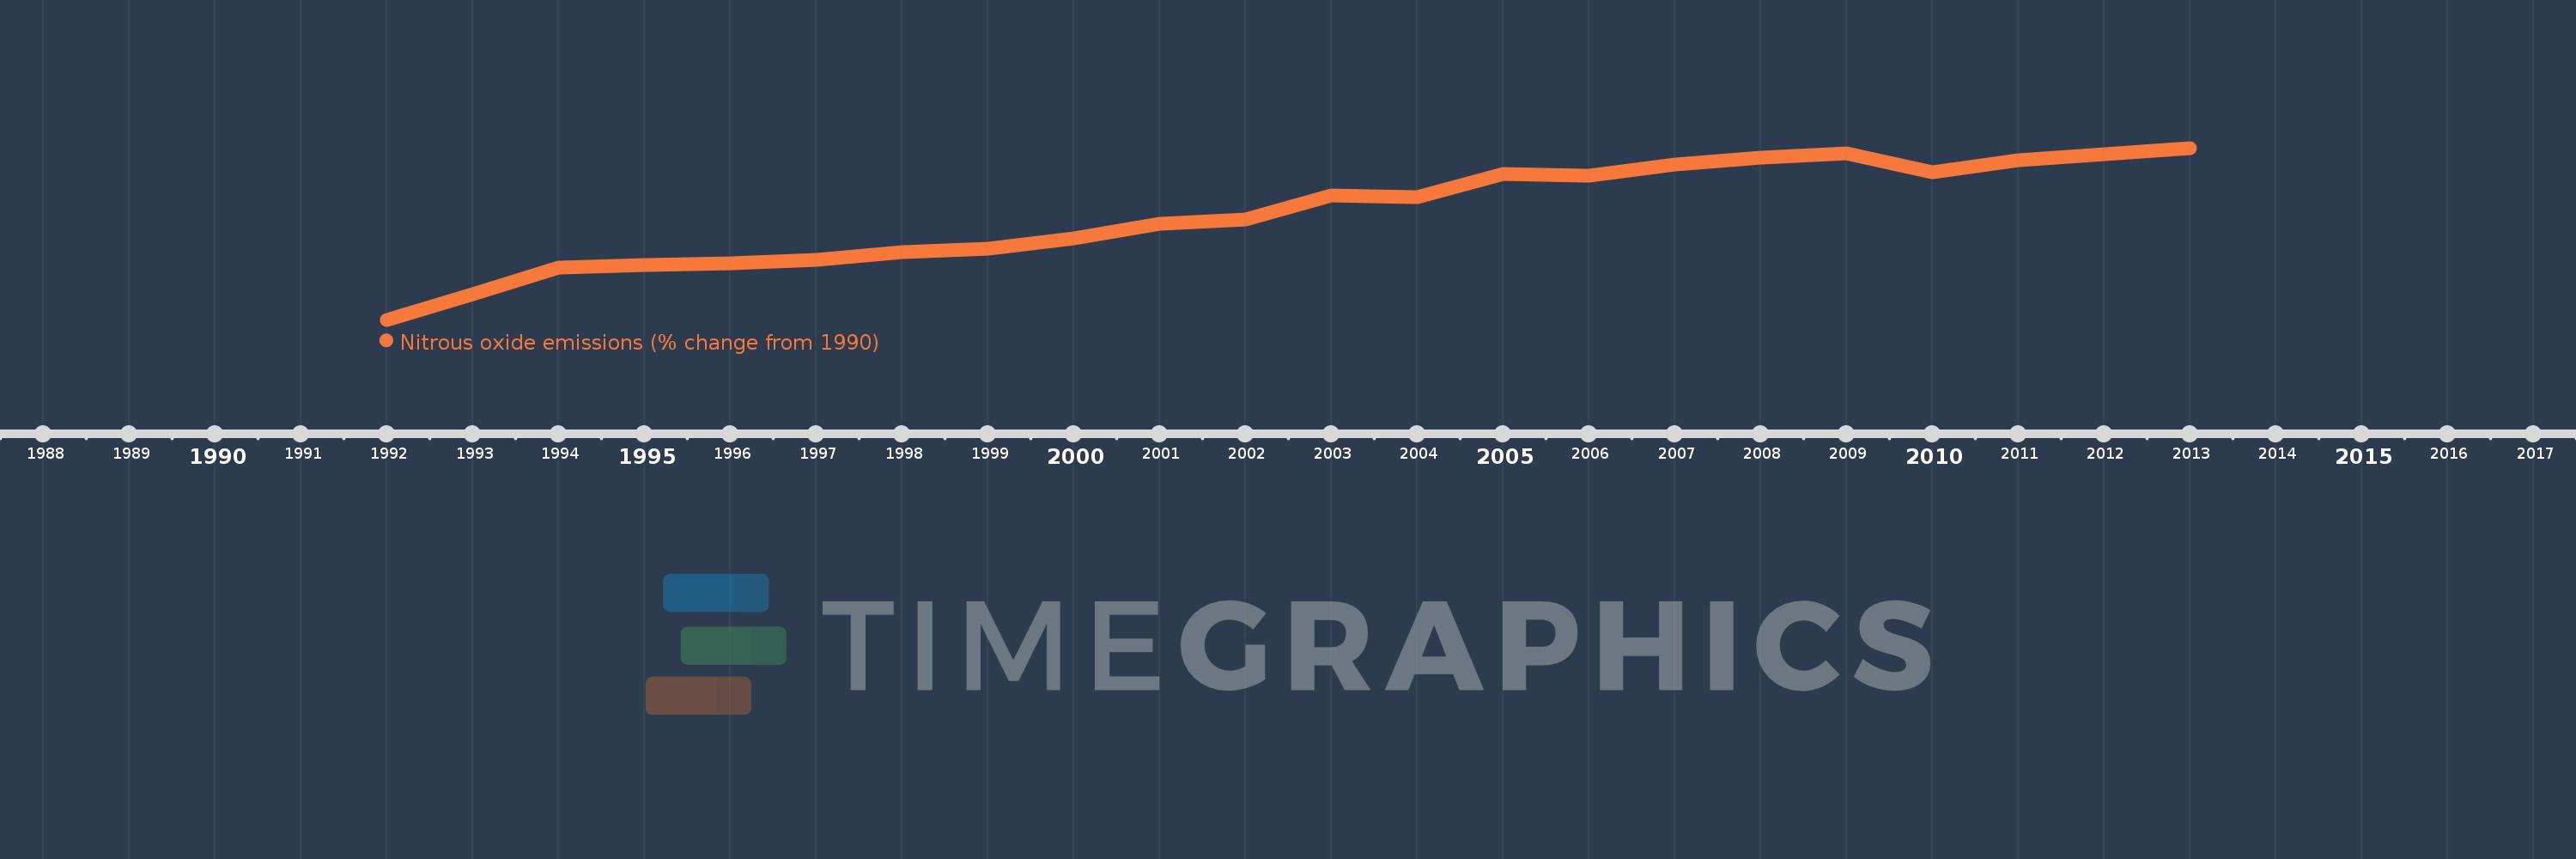
This timeline shows a graph from 1992 to 2013 of Guam. No data until 1991. Number of actual observations by date: 22.
Source name:
World Development Indicators
Source organization:
World Bank staff estimates from original source: European Commission, Joint Research Centre (JRC)/Netherlands Environmental Assessment Agency (PBL). Emission Database for Global Atmospheric Research (EDGAR): http://edgar.jrc.ec.europa.eu/.
Categories, topics:
Climate Change, Environment
Last updated:
apr 23, 2017
Indicators value changes by year
Meaning:
16.816
Minimum:
-4.881
jan 1, 1992
Maximum:
30.332
jan 1, 2013
At the date of observation
Value
Absolute change
Change from the previous value
jan 1, 1992
-4.881
-4.881
0.0%
jan 1, 1993
0.397
+5.278
-108.14%
jan 1, 1994
5.77
+5.373
1.35K%
jan 1, 1995
6.411
+0.641
11.11%
jan 1, 1996
6.711
+0.3
4.68%
jan 1, 1997
7.317
+0.606
9.03%
jan 1, 1998
8.982
+1.665
22.76%
jan 1, 1999
9.619
+0.636
7.08%
jan 1, 2000
11.8
+2.181
22.68%
jan 1, 2001
14.721
+2.921
24.75%
jan 1, 2002
15.703
+0.983
6.68%
jan 1, 2003
20.56
+4.857
30.93%
jan 1, 2004
20.292
-0.268
-1.3%
jan 1, 2005
24.933
+4.64
22.87%
jan 1, 2006
24.697
-0.236
-0.94%
jan 1, 2007
26.9
+2.203
8.92%
jan 1, 2008
28.371
+1.471
5.47%
jan 1, 2009
29.229
+0.858
3.02%
jan 1, 2010
25.264
-3.965
-13.57%
jan 1, 2011
27.777
+2.513
9.95%
jan 1, 2012
29.055
+1.278
4.6%
jan 1, 2013
30.332
+1.278
4.4%
Ranking of countries by current statistics by years