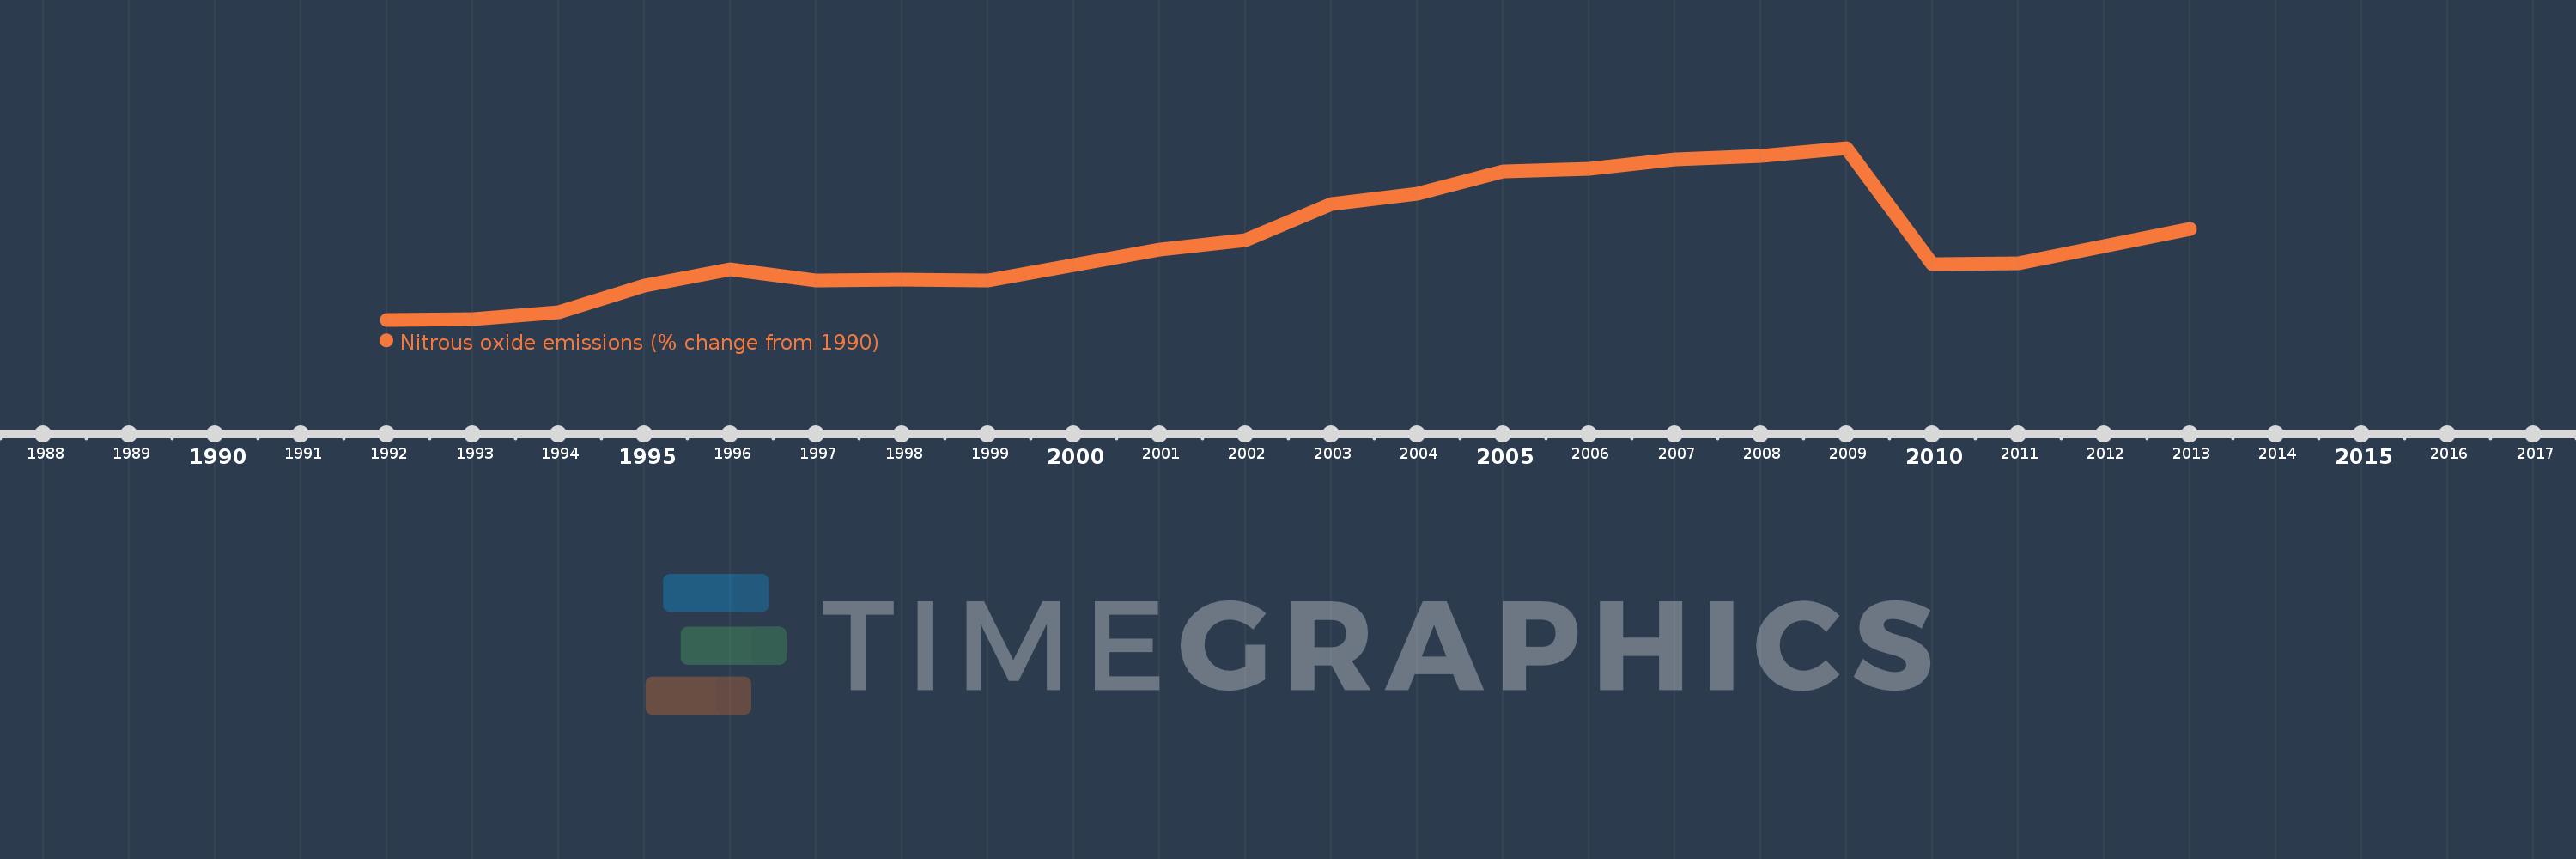
This timeline shows a graph from 1992 to 2013 of New Zealand. No data until 1991. Number of actual observations by date: 22.
Source name:
World Development Indicators
Source organization:
World Bank staff estimates from original source: European Commission, Joint Research Centre (JRC)/Netherlands Environmental Assessment Agency (PBL). Emission Database for Global Atmospheric Research (EDGAR): http://edgar.jrc.ec.europa.eu/.
Categories, topics:
Climate Change, Environment
Last updated:
apr 23, 2017
Indicators value changes by year
Meaning:
11.169
Minimum:
-0.957
jan 1, 1992
Maximum:
25.583
jan 1, 2009
At the date of observation
Value
Absolute change
Change from the previous value
jan 1, 1992
-0.957
-0.957
0.0%
jan 1, 1993
-0.893
+0.065
-6.75%
jan 1, 1994
0.152
+1.044
-116.98%
jan 1, 1995
4.288
+4.137
2.73K%
jan 1, 1996
6.854
+2.566
59.83%
jan 1, 1997
5.151
-1.703
-24.84%
jan 1, 1998
5.27
+0.119
2.31%
jan 1, 1999
5.06
-0.21
-3.98%
jan 1, 2000
7.431
+2.37
46.84%
jan 1, 2001
9.871
+2.44
32.83%
jan 1, 2002
11.278
+1.407
14.26%
jan 1, 2003
16.905
+5.627
49.9%
jan 1, 2004
18.447
+1.542
9.12%
jan 1, 2005
21.911
+3.464
18.78%
jan 1, 2006
22.337
+0.426
1.94%
jan 1, 2007
23.839
+1.502
6.72%
jan 1, 2008
24.318
+0.478
2.01%
jan 1, 2009
25.583
+1.265
5.2%
jan 1, 2010
7.692
-17.891
-69.93%
jan 1, 2011
7.82
+0.129
1.67%
jan 1, 2012
10.354
+2.533
32.39%
jan 1, 2013
13.016
+2.662
25.71%
Ranking of countries by current statistics by years