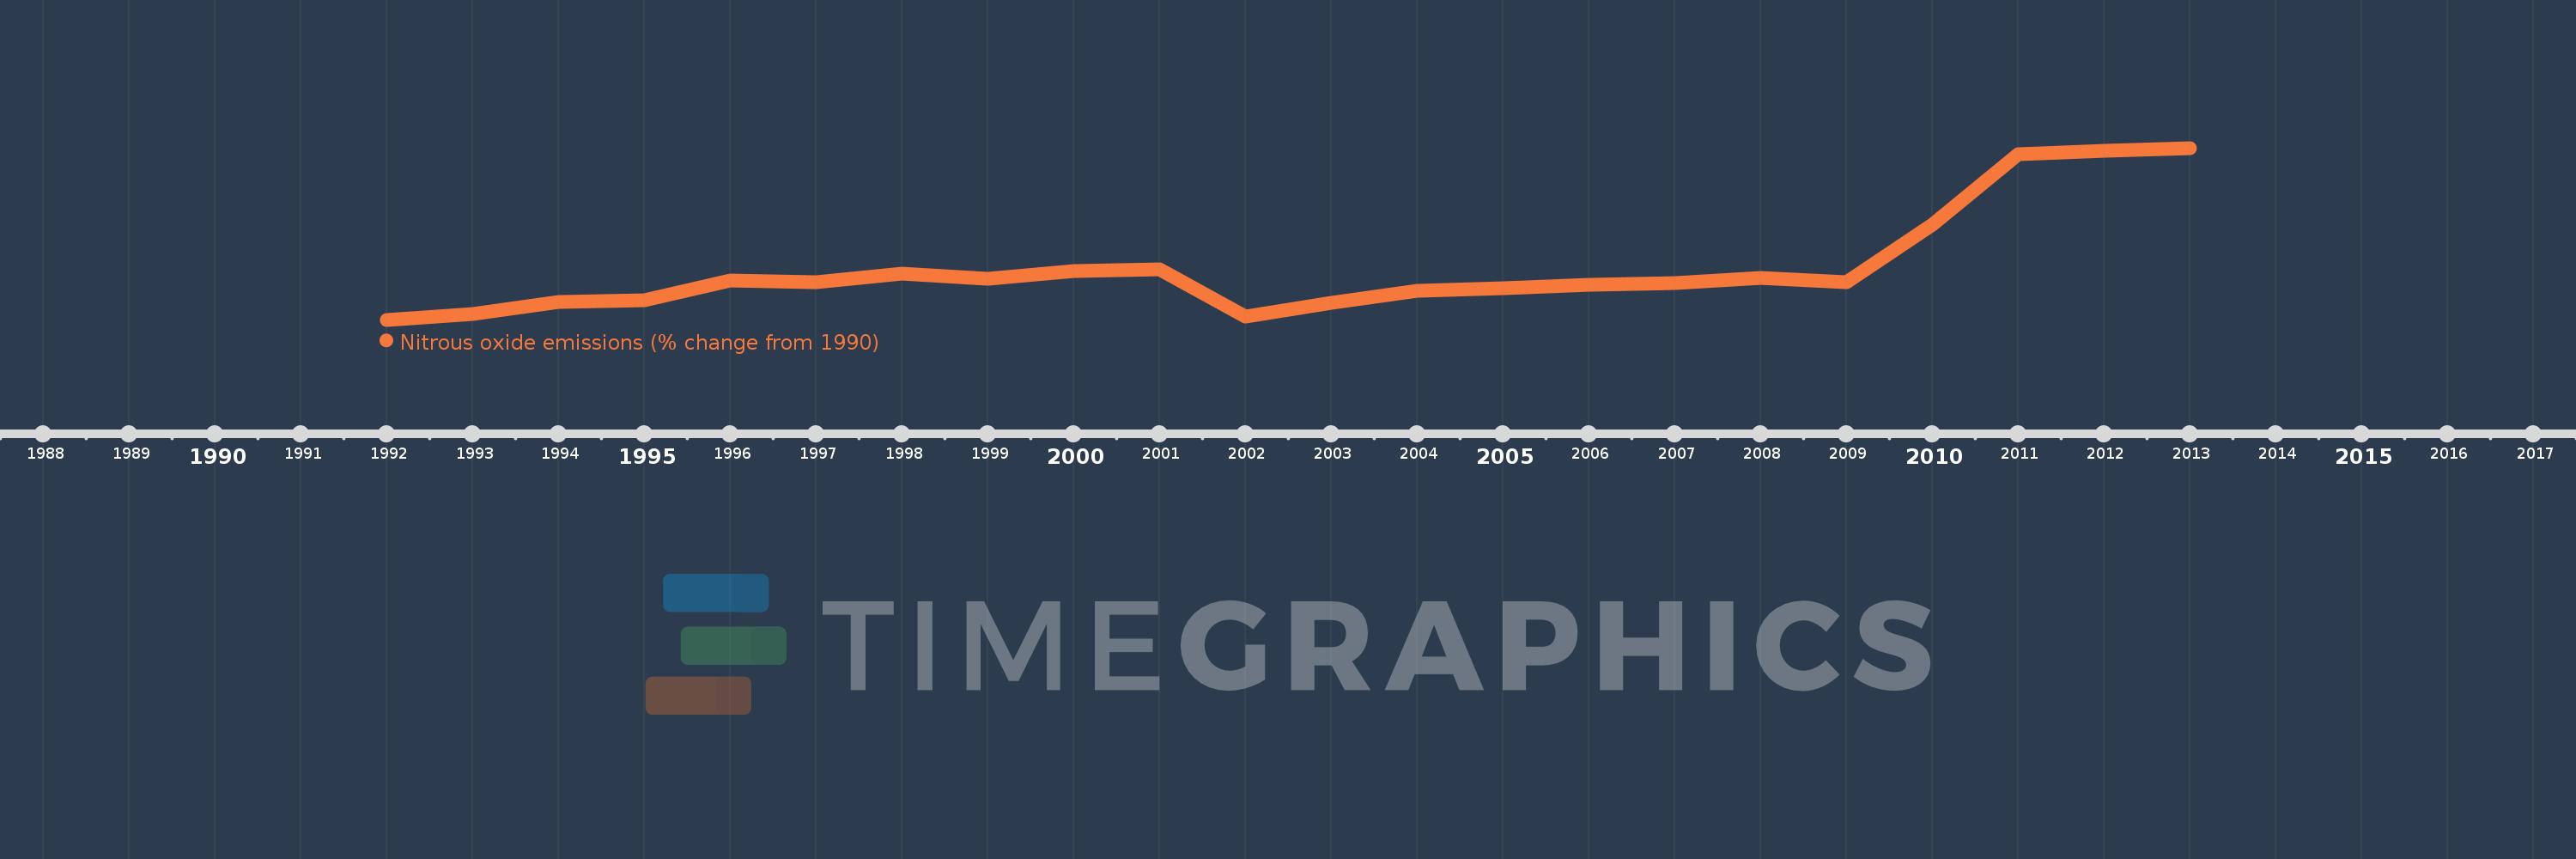
This timeline shows a graph from 1992 to 2013 of United Arab Emirates. No data until 1991. Number of actual observations by date: 22.
Source name:
World Development Indicators
Source organization:
World Bank staff estimates from original source: European Commission, Joint Research Centre (JRC)/Netherlands Environmental Assessment Agency (PBL). Emission Database for Global Atmospheric Research (EDGAR): http://edgar.jrc.ec.europa.eu/.
Categories, topics:
Climate Change, Environment
Last updated:
apr 23, 2017
Indicators value changes by year
Meaning:
44.399
Minimum:
7.813
jan 1, 1992
Maximum:
129.224
jan 1, 2013
At the date of observation
Value
Absolute change
Change from the previous value
jan 1, 1992
7.813
+7.813
0.0%
jan 1, 1993
11.927
+4.114
52.66%
jan 1, 1994
20.658
+8.731
73.2%
jan 1, 1995
21.465
+0.806
3.9%
jan 1, 1996
35.73
+14.265
66.46%
jan 1, 1997
34.519
-1.211
-3.39%
jan 1, 1998
40.347
+5.828
16.88%
jan 1, 1999
36.595
-3.752
-9.3%
jan 1, 2000
42.402
+5.807
15.87%
jan 1, 2001
43.246
+0.844
1.99%
jan 1, 2002
10.311
-32.935
-76.16%
jan 1, 2003
19.752
+9.441
91.56%
jan 1, 2004
27.977
+8.225
41.64%
jan 1, 2005
30.189
+2.211
7.9%
jan 1, 2006
32.259
+2.071
6.86%
jan 1, 2007
33.462
+1.202
3.73%
jan 1, 2008
37.586
+4.124
12.32%
jan 1, 2009
34.337
-3.248
-8.64%
jan 1, 2010
75.274
+40.936
119.22%
jan 1, 2011
124.729
+49.456
65.7%
jan 1, 2012
126.977
+2.247
1.8%
jan 1, 2013
129.224
+2.247
1.77%
Ranking of countries by current statistics by years