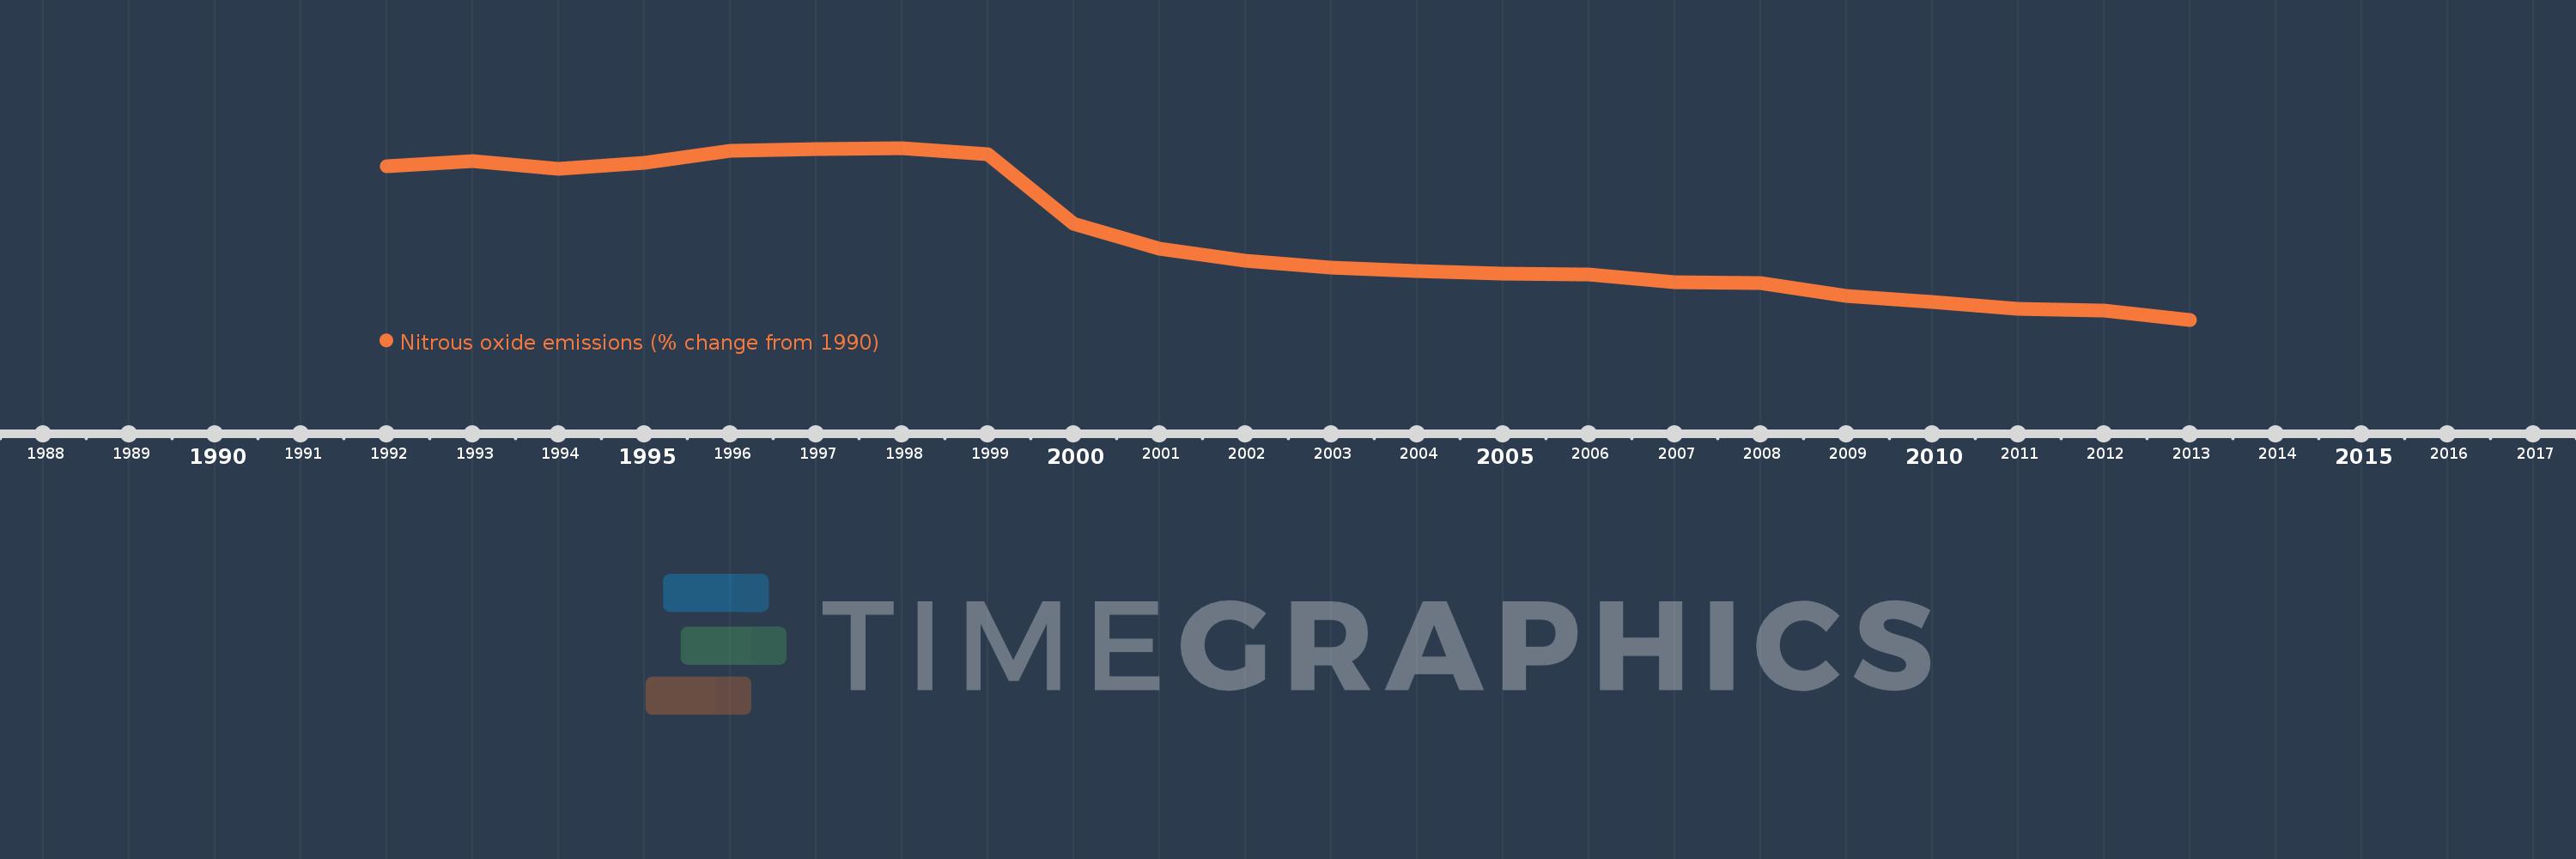
This timeline shows a graph from 1992 to 2013 of Japan. No data until 1991. Number of actual observations by date: 22.
Source name:
World Development Indicators
Source organization:
World Bank staff estimates from original source: European Commission, Joint Research Centre (JRC)/Netherlands Environmental Assessment Agency (PBL). Emission Database for Global Atmospheric Research (EDGAR): http://edgar.jrc.ec.europa.eu/.
Categories, topics:
Climate Change, Environment
Last updated:
apr 23, 2017
Indicators value changes by year
Meaning:
-14.92
Minimum:
-32.564
jan 1, 2013
Maximum:
3.475
jan 1, 1998
At the date of observation
Value
Absolute change
Change from the previous value
jan 1, 1992
-0.306
-0.306
0.0%
jan 1, 1993
0.779
+1.085
-354.25%
jan 1, 1994
-0.968
-1.746
-224.25%
jan 1, 1995
0.285
+1.253
-129.49%
jan 1, 1996
2.934
+2.648
928.24%
jan 1, 1997
3.201
+0.267
9.1%
jan 1, 1998
3.475
+0.274
8.57%
jan 1, 1999
2.213
-1.262
-36.32%
jan 1, 2000
-12.484
-14.697
-664.16%
jan 1, 2001
-17.676
-5.192
41.59%
jan 1, 2002
-20.174
-2.498
14.13%
jan 1, 2003
-21.712
-1.538
7.62%
jan 1, 2004
-22.415
-0.703
3.24%
jan 1, 2005
-22.917
-0.502
2.24%
jan 1, 2006
-23.046
-0.129
0.56%
jan 1, 2007
-24.642
-1.596
6.92%
jan 1, 2008
-24.825
-0.183
0.74%
jan 1, 2009
-27.594
-2.769
11.15%
jan 1, 2010
-28.84
-1.245
4.51%
jan 1, 2011
-30.262
-1.423
4.93%
jan 1, 2012
-30.702
-0.439
1.45%
jan 1, 2013
-32.564
-1.862
6.06%
Ranking of countries by current statistics by years