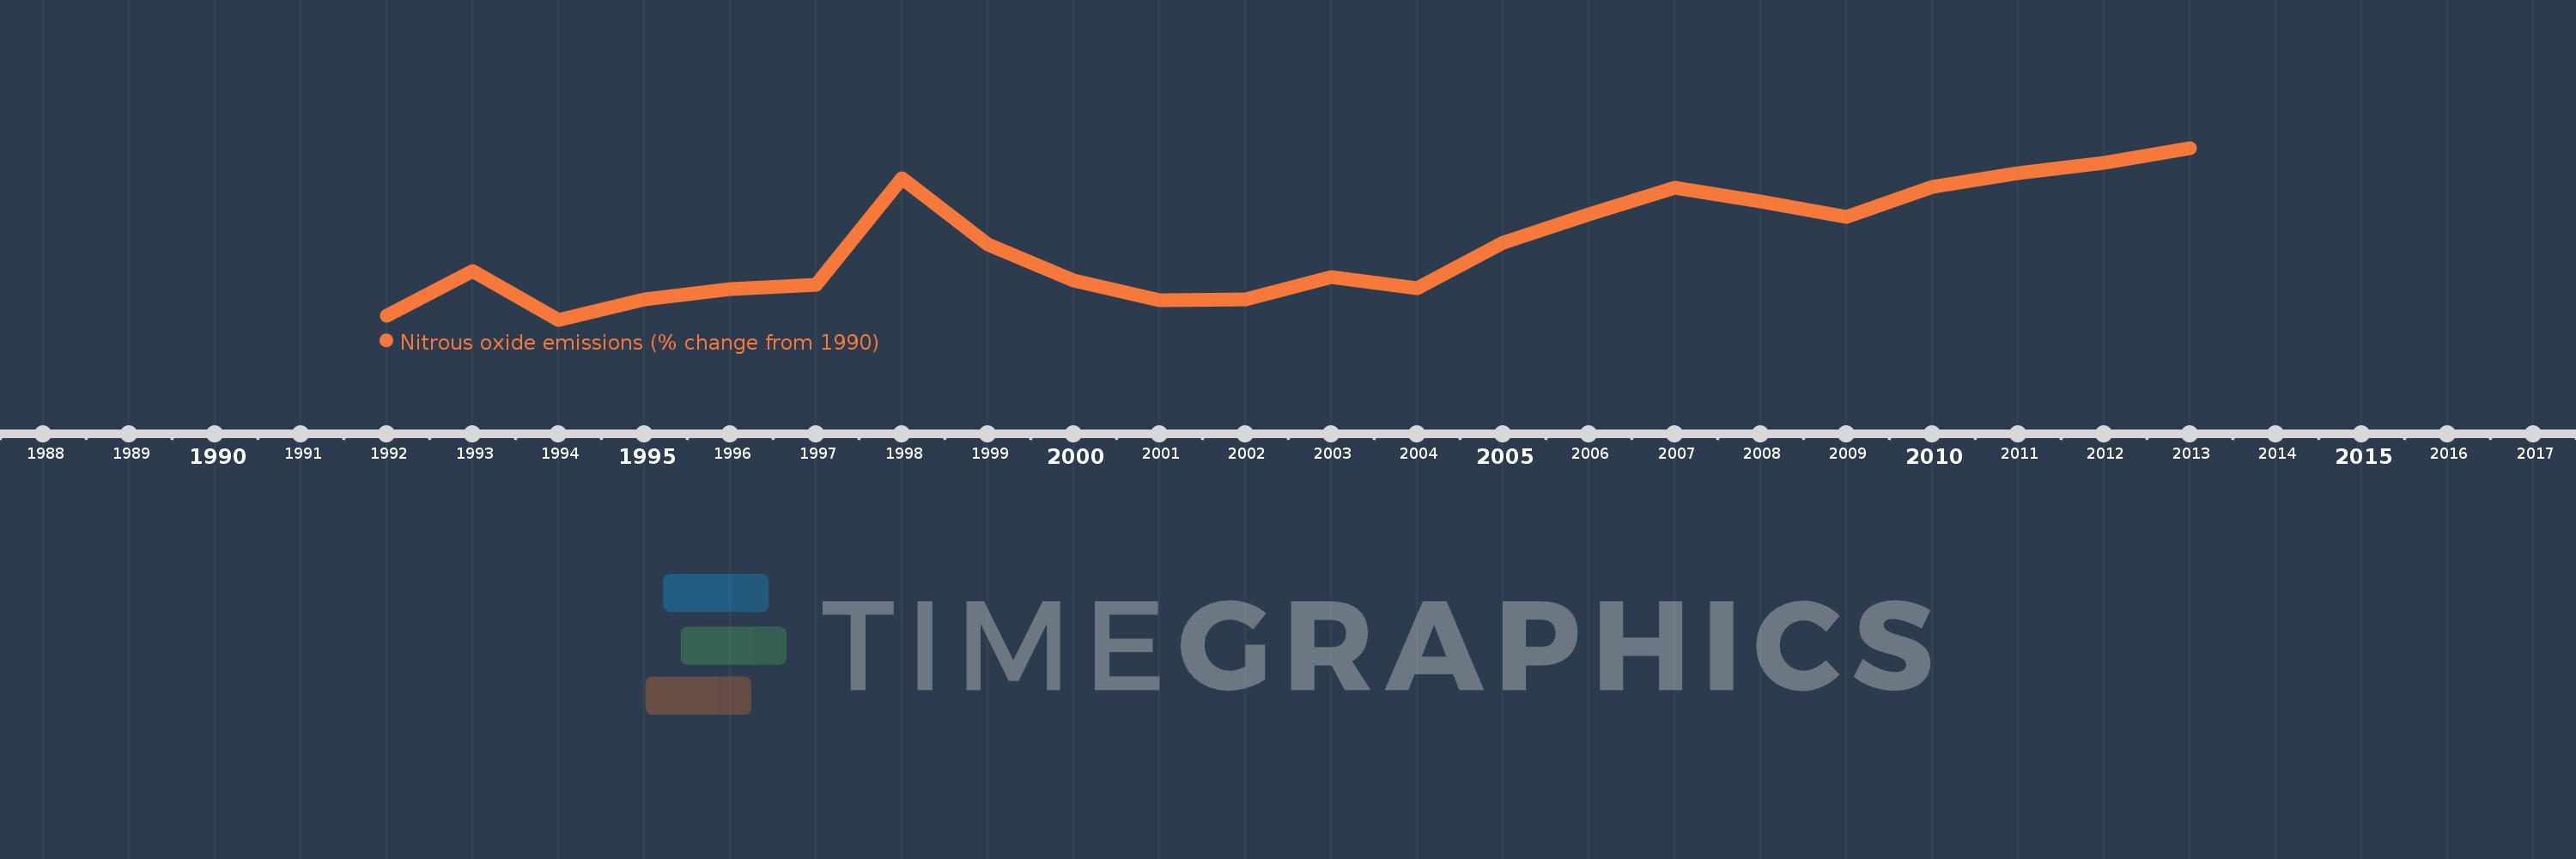
This timeline shows a graph from 1992 to 2013 of Middle income. No data until 1991. Number of actual observations by date: 22.
Source name:
World Development Indicators
Source organization:
World Bank staff estimates from original source: European Commission, Joint Research Centre (JRC)/Netherlands Environmental Assessment Agency (PBL). Emission Database for Global Atmospheric Research (EDGAR): http://edgar.jrc.ec.europa.eu/.
Categories, topics:
Climate Change, Environment
Last updated:
apr 23, 2017
Indicators value changes by year
Meaning:
12.752
Minimum:
0.953
jan 1, 1994
Maximum:
27.959
jan 1, 2013
At the date of observation
Value
Absolute change
Change from the previous value
jan 1, 1992
1.615
+1.615
0.0%
jan 1, 1993
8.567
+6.952
430.45%
jan 1, 1994
0.953
-7.614
-88.88%
jan 1, 1995
4.116
+3.163
331.94%
jan 1, 1996
5.731
+1.616
39.26%
jan 1, 1997
6.467
+0.735
12.83%
jan 1, 1998
23.214
+16.747
258.98%
jan 1, 1999
12.774
-10.44
-44.97%
jan 1, 2000
7.061
-5.714
-44.73%
jan 1, 2001
4.012
-3.049
-43.18%
jan 1, 2002
4.163
+0.151
3.77%
jan 1, 2003
7.703
+3.54
85.03%
jan 1, 2004
5.86
-1.843
-23.93%
jan 1, 2005
13.004
+7.144
121.92%
jan 1, 2006
17.577
+4.573
35.17%
jan 1, 2007
21.699
+4.122
23.45%
jan 1, 2008
19.499
-2.2
-10.14%
jan 1, 2009
17.097
-2.402
-12.32%
jan 1, 2010
21.853
+4.756
27.82%
jan 1, 2011
23.936
+2.083
9.53%
jan 1, 2012
25.684
+1.748
7.3%
jan 1, 2013
27.959
+2.276
8.86%
Ranking of countries by current statistics by years