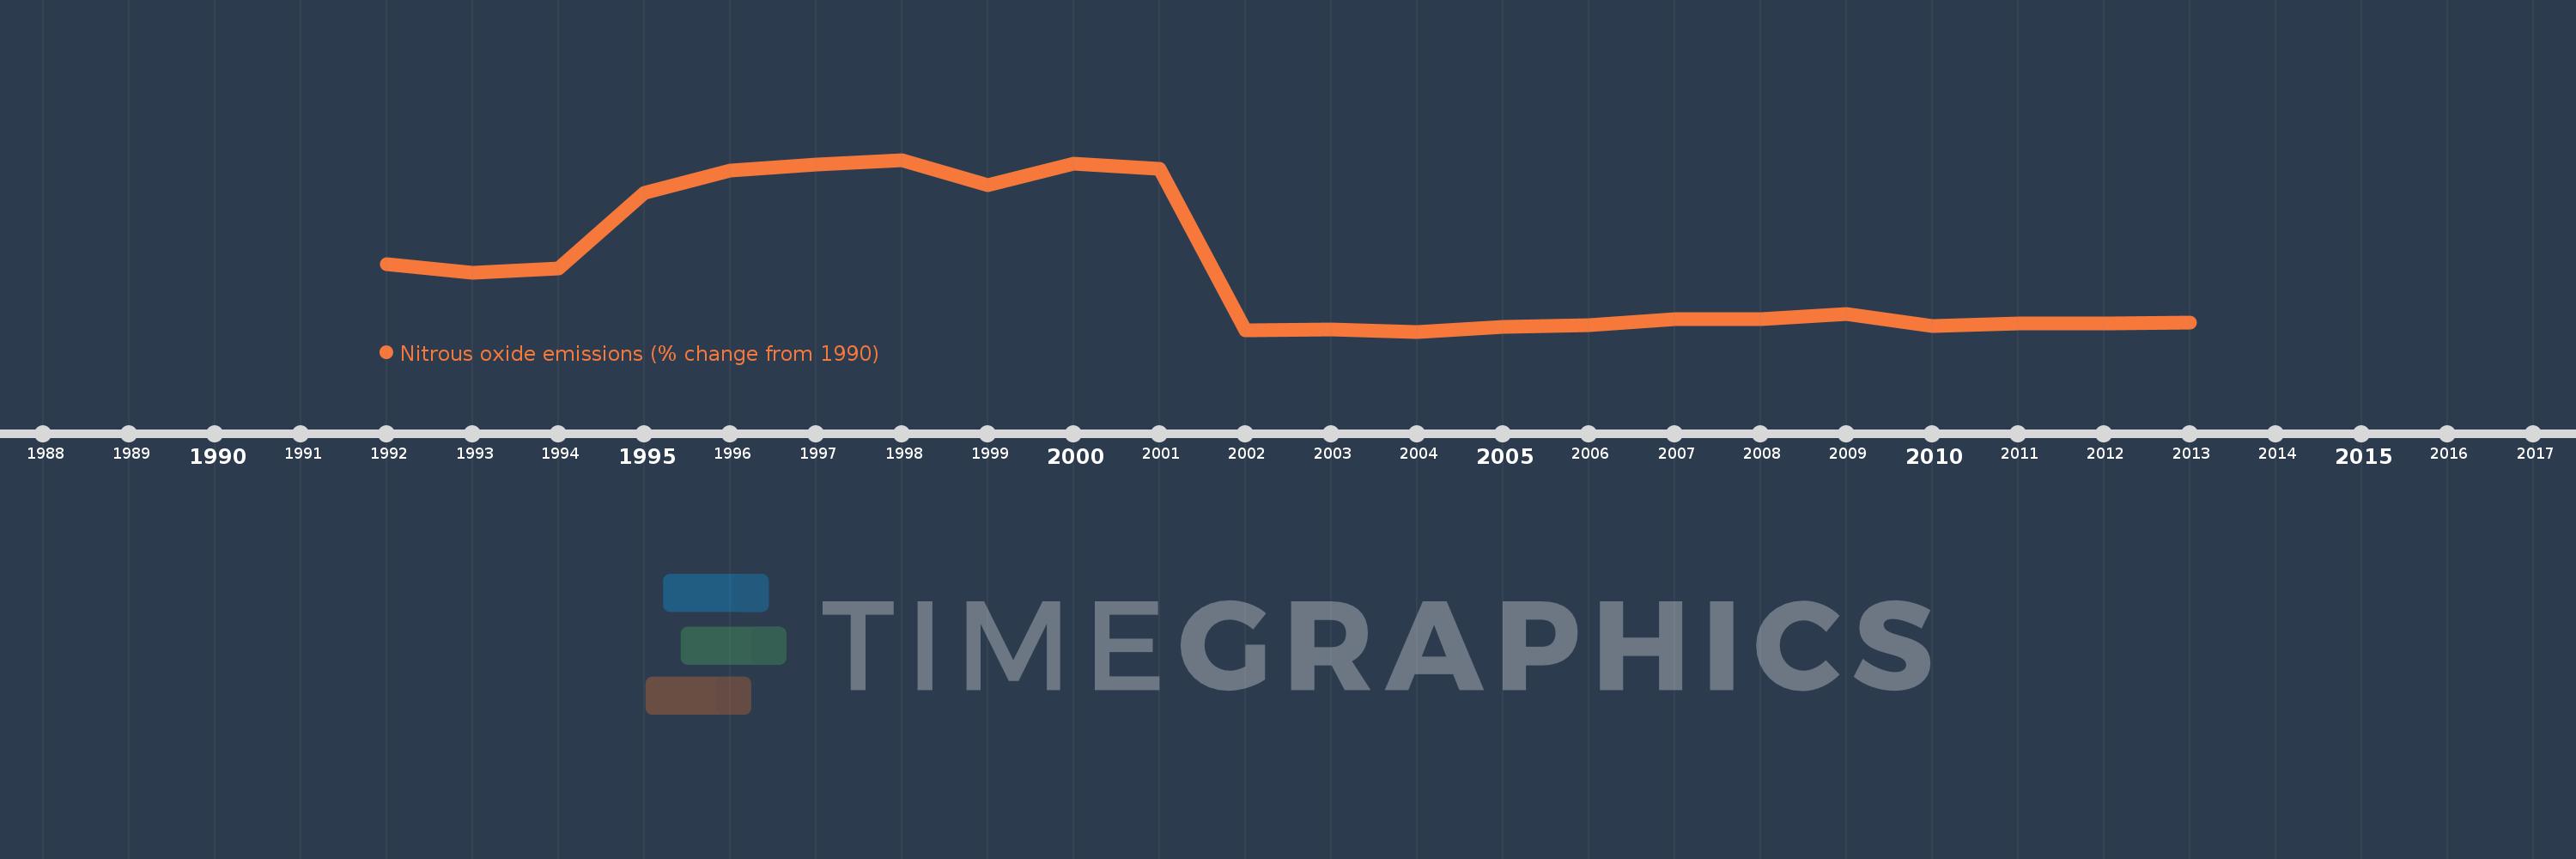
This timeline shows a graph from 1992 to 2013 of Trinidad and Tobago. No data until 1991. Number of actual observations by date: 22.
Source name:
World Development Indicators
Source organization:
World Bank staff estimates from original source: European Commission, Joint Research Centre (JRC)/Netherlands Environmental Assessment Agency (PBL). Emission Database for Global Atmospheric Research (EDGAR): http://edgar.jrc.ec.europa.eu/.
Categories, topics:
Climate Change, Environment
Last updated:
apr 23, 2017
Indicators value changes by year
Meaning:
-0.3
Minimum:
-59.907
jan 1, 2004
Maximum:
101.653
jan 1, 1998
At the date of observation
Value
Absolute change
Change from the previous value
jan 1, 1992
3.744
+3.744
0.0%
jan 1, 1993
-4.221
-7.965
-212.75%
jan 1, 1994
-0.608
+3.613
-85.6%
jan 1, 1995
70.658
+71.266
-11.72K%
jan 1, 1996
91.702
+21.044
29.78%
jan 1, 1997
97.541
+5.838
6.37%
jan 1, 1998
101.653
+4.113
4.22%
jan 1, 1999
77.835
-23.818
-23.43%
jan 1, 2000
97.927
+20.091
25.81%
jan 1, 2001
92.773
-5.153
-5.26%
jan 1, 2002
-58.804
-151.577
-163.38%
jan 1, 2003
-57.86
+0.944
-1.61%
jan 1, 2004
-59.907
-2.047
3.54%
jan 1, 2005
-55.56
+4.348
-7.26%
jan 1, 2006
-54.133
+1.427
-2.57%
jan 1, 2007
-48.014
+6.119
-11.3%
jan 1, 2008
-48.085
-0.071
0.15%
jan 1, 2009
-43.037
+5.048
-10.5%
jan 1, 2010
-54.371
-11.334
26.34%
jan 1, 2011
-52.419
+1.952
-3.59%
jan 1, 2012
-51.943
+0.476
-0.91%
jan 1, 2013
-51.468
+0.476
-0.92%
Ranking of countries by current statistics by years