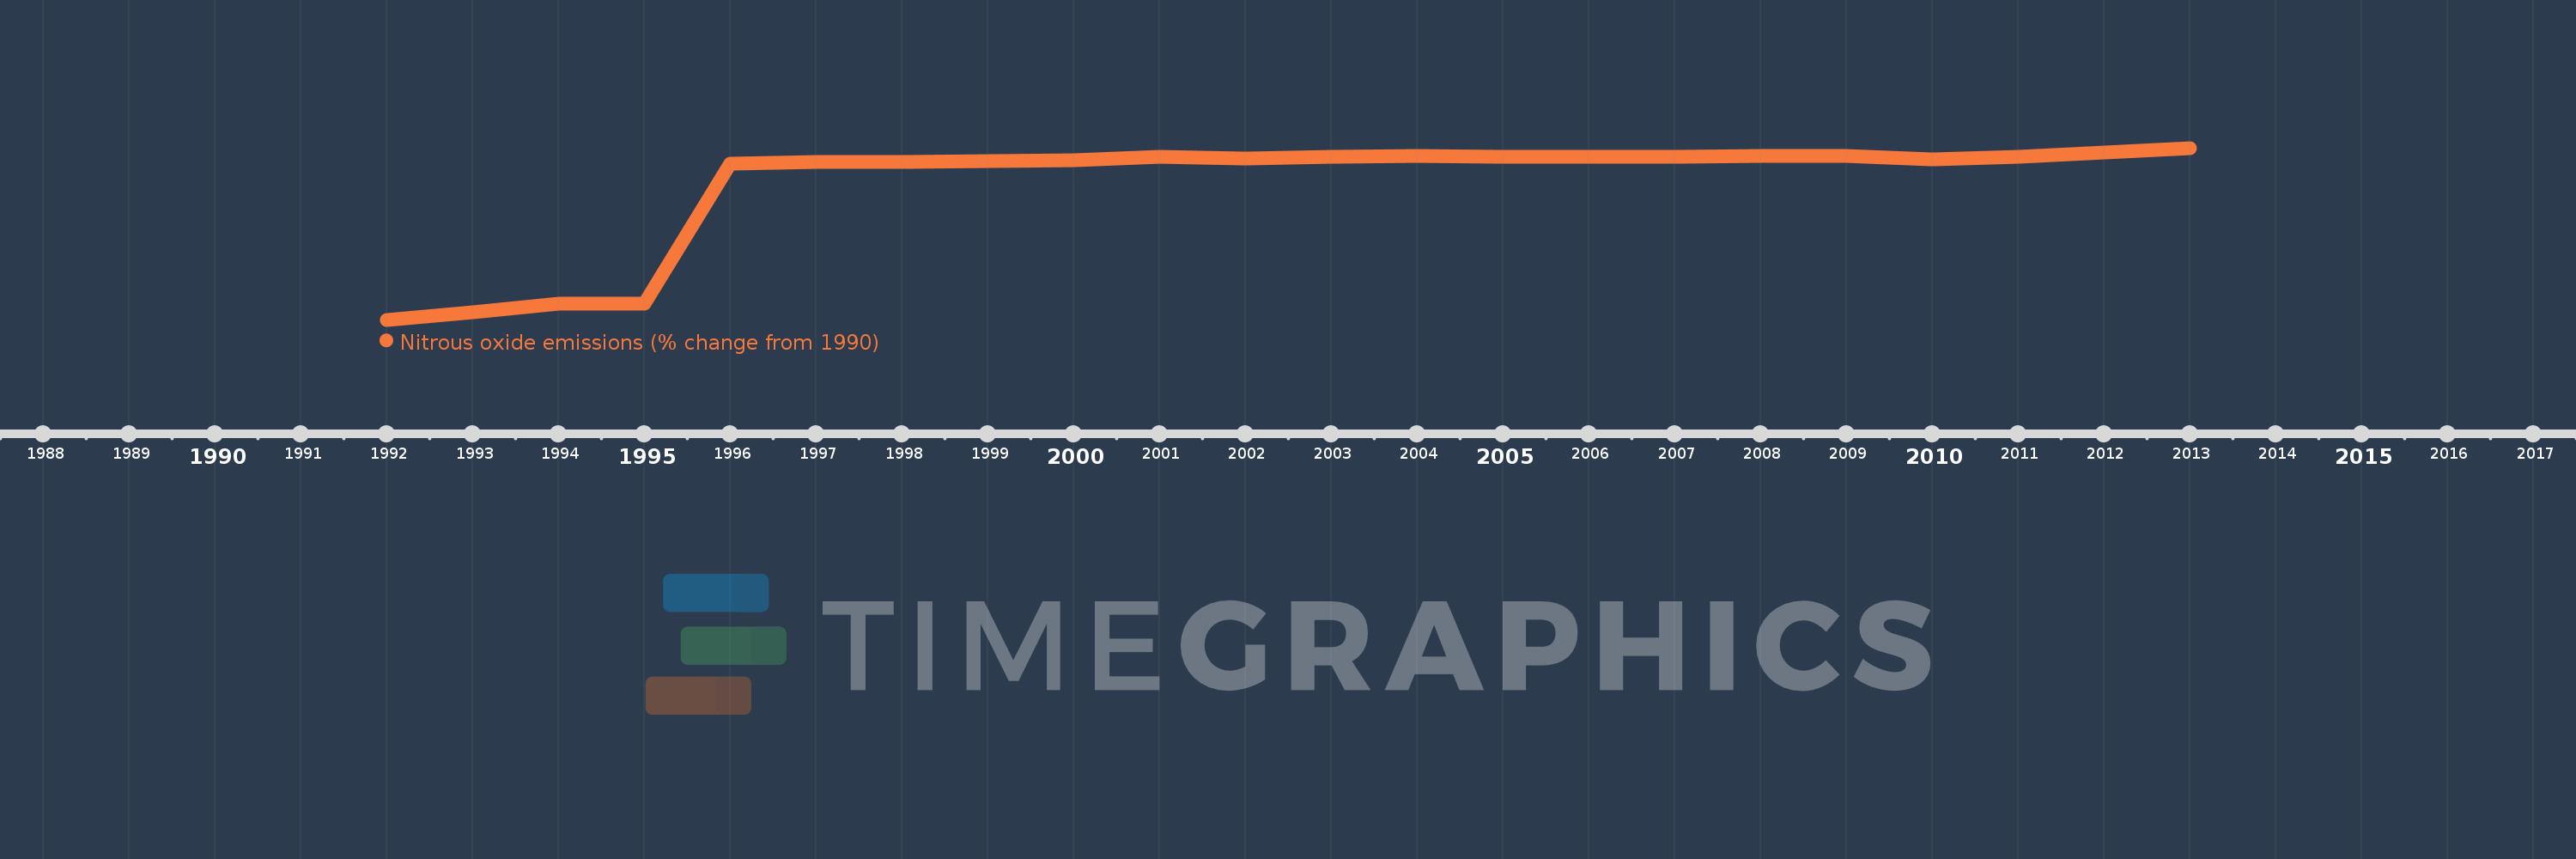
This timeline shows a graph from 1992 to 2013 of Micronesia, Fed. Sts.. No data until 1991. Number of actual observations by date: 22.
Source name:
World Development Indicators
Source organization:
World Bank staff estimates from original source: European Commission, Joint Research Centre (JRC)/Netherlands Environmental Assessment Agency (PBL). Emission Database for Global Atmospheric Research (EDGAR): http://edgar.jrc.ec.europa.eu/.
Categories, topics:
Climate Change, Environment
Last updated:
apr 23, 2017
Indicators value changes by year
Meaning:
56.841
Minimum:
3.122
jan 1, 1992
Maximum:
71.677
jan 1, 2013
At the date of observation
Value
Absolute change
Change from the previous value
jan 1, 1992
3.122
+3.122
0.0%
jan 1, 1993
6.259
+3.137
100.46%
jan 1, 1994
9.396
+3.137
50.12%
jan 1, 1995
9.475
+0.079
0.84%
jan 1, 1996
65.551
+56.076
591.84%
jan 1, 1997
66.038
+0.487
0.74%
jan 1, 1998
66.252
+0.214
0.32%
jan 1, 1999
66.578
+0.327
0.49%
jan 1, 2000
66.879
+0.301
0.45%
jan 1, 2001
68.022
+1.143
1.71%
jan 1, 2002
67.569
-0.453
-0.67%
jan 1, 2003
68.299
+0.73
1.08%
jan 1, 2004
68.509
+0.21
0.31%
jan 1, 2005
68.25
-0.259
-0.38%
jan 1, 2006
68.195
-0.054
-0.08%
jan 1, 2007
68.184
-0.012
-0.02%
jan 1, 2008
68.46
+0.276
0.41%
jan 1, 2009
68.458
-0.002
0.0%
jan 1, 2010
67.027
-1.432
-2.09%
jan 1, 2011
68.311
+1.284
1.92%
jan 1, 2012
69.994
+1.683
2.46%
jan 1, 2013
71.677
+1.683
2.4%
Ranking of countries by current statistics by years