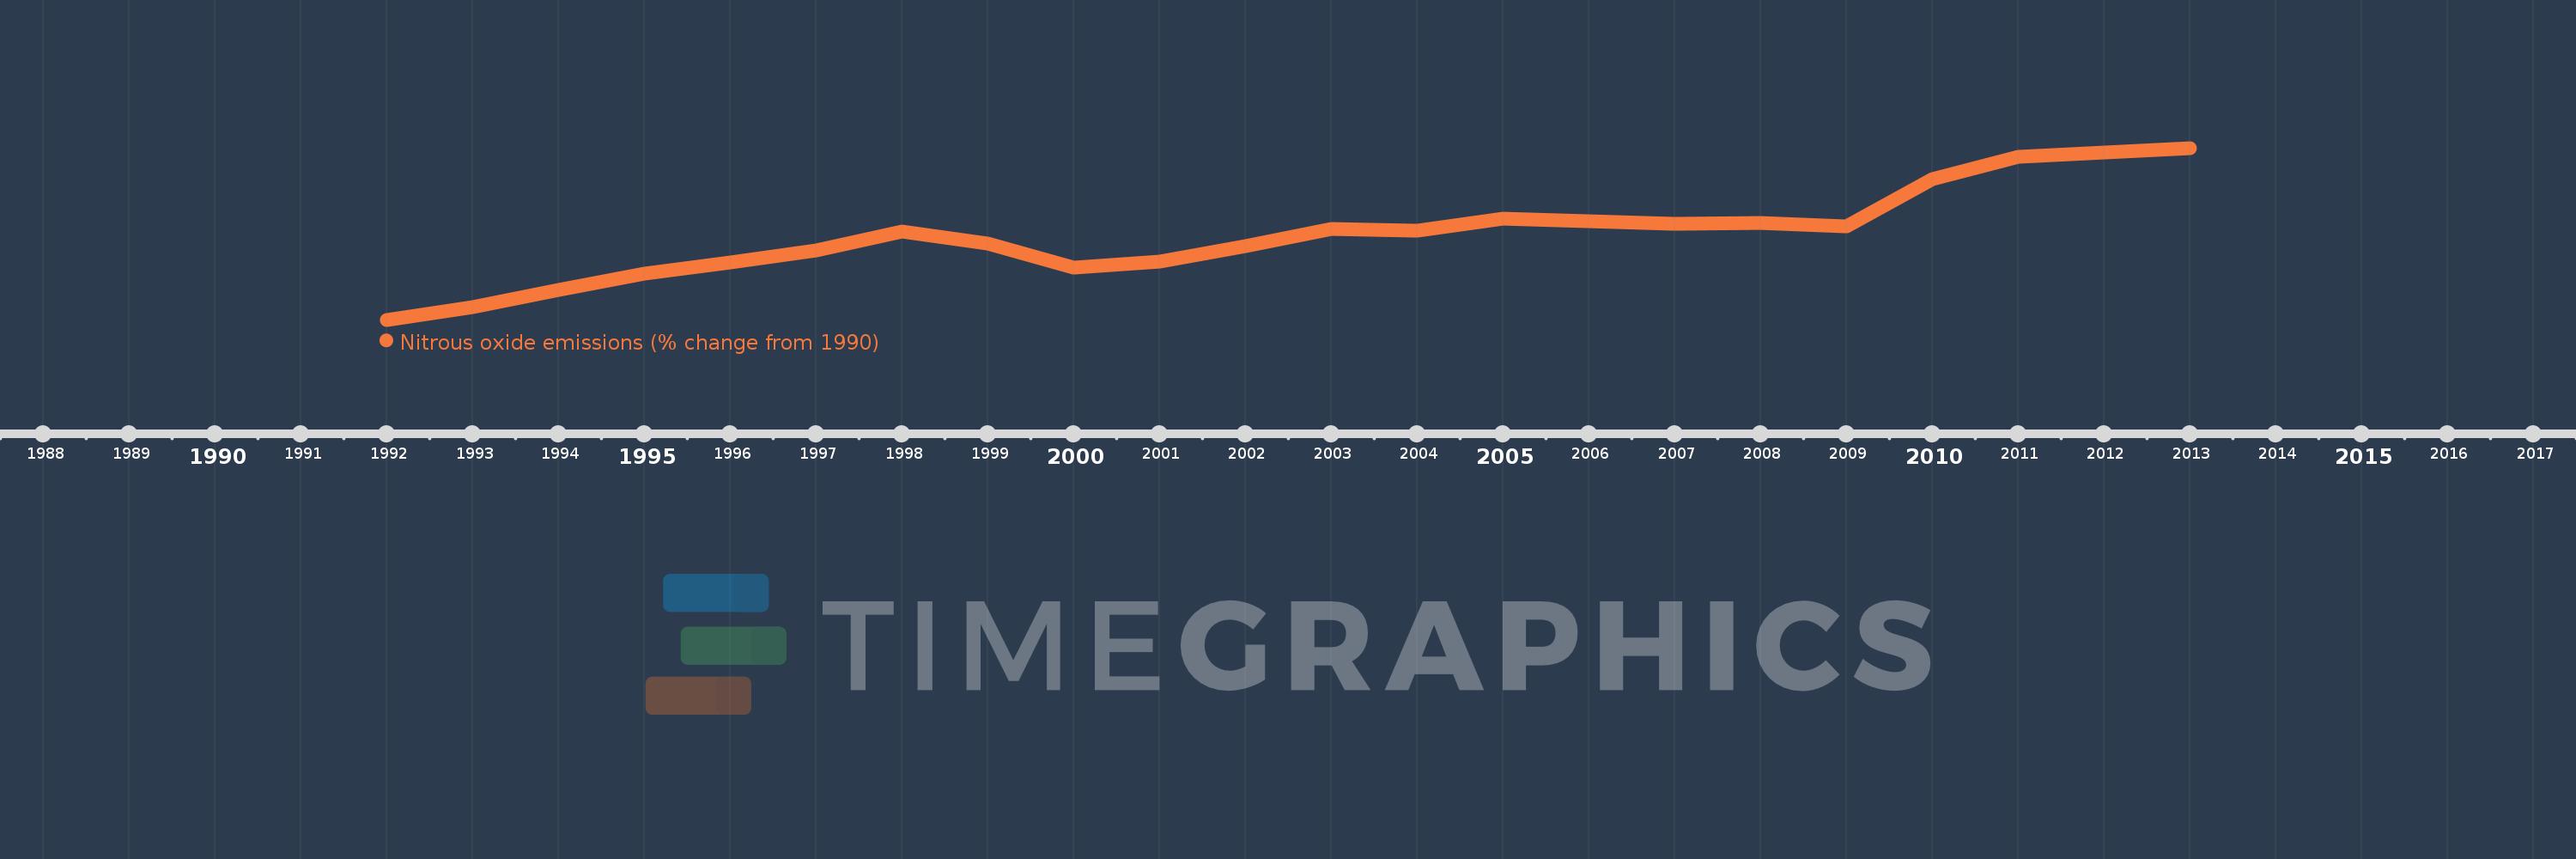
This timeline shows a graph from 1992 to 2013 of Ecuador. No data until 1991. Number of actual observations by date: 22.
Source name:
World Development Indicators
Source organization:
World Bank staff estimates from original source: European Commission, Joint Research Centre (JRC)/Netherlands Environmental Assessment Agency (PBL). Emission Database for Global Atmospheric Research (EDGAR): http://edgar.jrc.ec.europa.eu/.
Categories, topics:
Climate Change, Environment
Last updated:
apr 23, 2017
Indicators value changes by year
Meaning:
37.619
Minimum:
5.747
jan 1, 1992
Maximum:
70.132
jan 1, 2013
At the date of observation
Value
Absolute change
Change from the previous value
jan 1, 1992
5.747
+5.747
0.0%
jan 1, 1993
10.397
+4.649
80.9%
jan 1, 1994
16.99
+6.593
63.42%
jan 1, 1995
22.996
+6.006
35.35%
jan 1, 1996
27.201
+4.205
18.29%
jan 1, 1997
31.748
+4.547
16.71%
jan 1, 1998
38.764
+7.016
22.1%
jan 1, 1999
34.372
-4.392
-11.33%
jan 1, 2000
25.143
-9.229
-26.85%
jan 1, 2001
27.432
+2.289
9.11%
jan 1, 2002
33.458
+6.026
21.97%
jan 1, 2003
39.737
+6.28
18.77%
jan 1, 2004
39.26
-0.477
-1.2%
jan 1, 2005
43.639
+4.379
11.15%
jan 1, 2006
42.785
-0.854
-1.96%
jan 1, 2007
41.598
-1.187
-2.77%
jan 1, 2008
41.948
+0.35
0.84%
jan 1, 2009
40.59
-1.358
-3.24%
jan 1, 2010
58.432
+17.842
43.96%
jan 1, 2011
66.796
+8.363
14.31%
jan 1, 2012
68.464
+1.668
2.5%
jan 1, 2013
70.132
+1.668
2.44%
Ranking of countries by current statistics by years