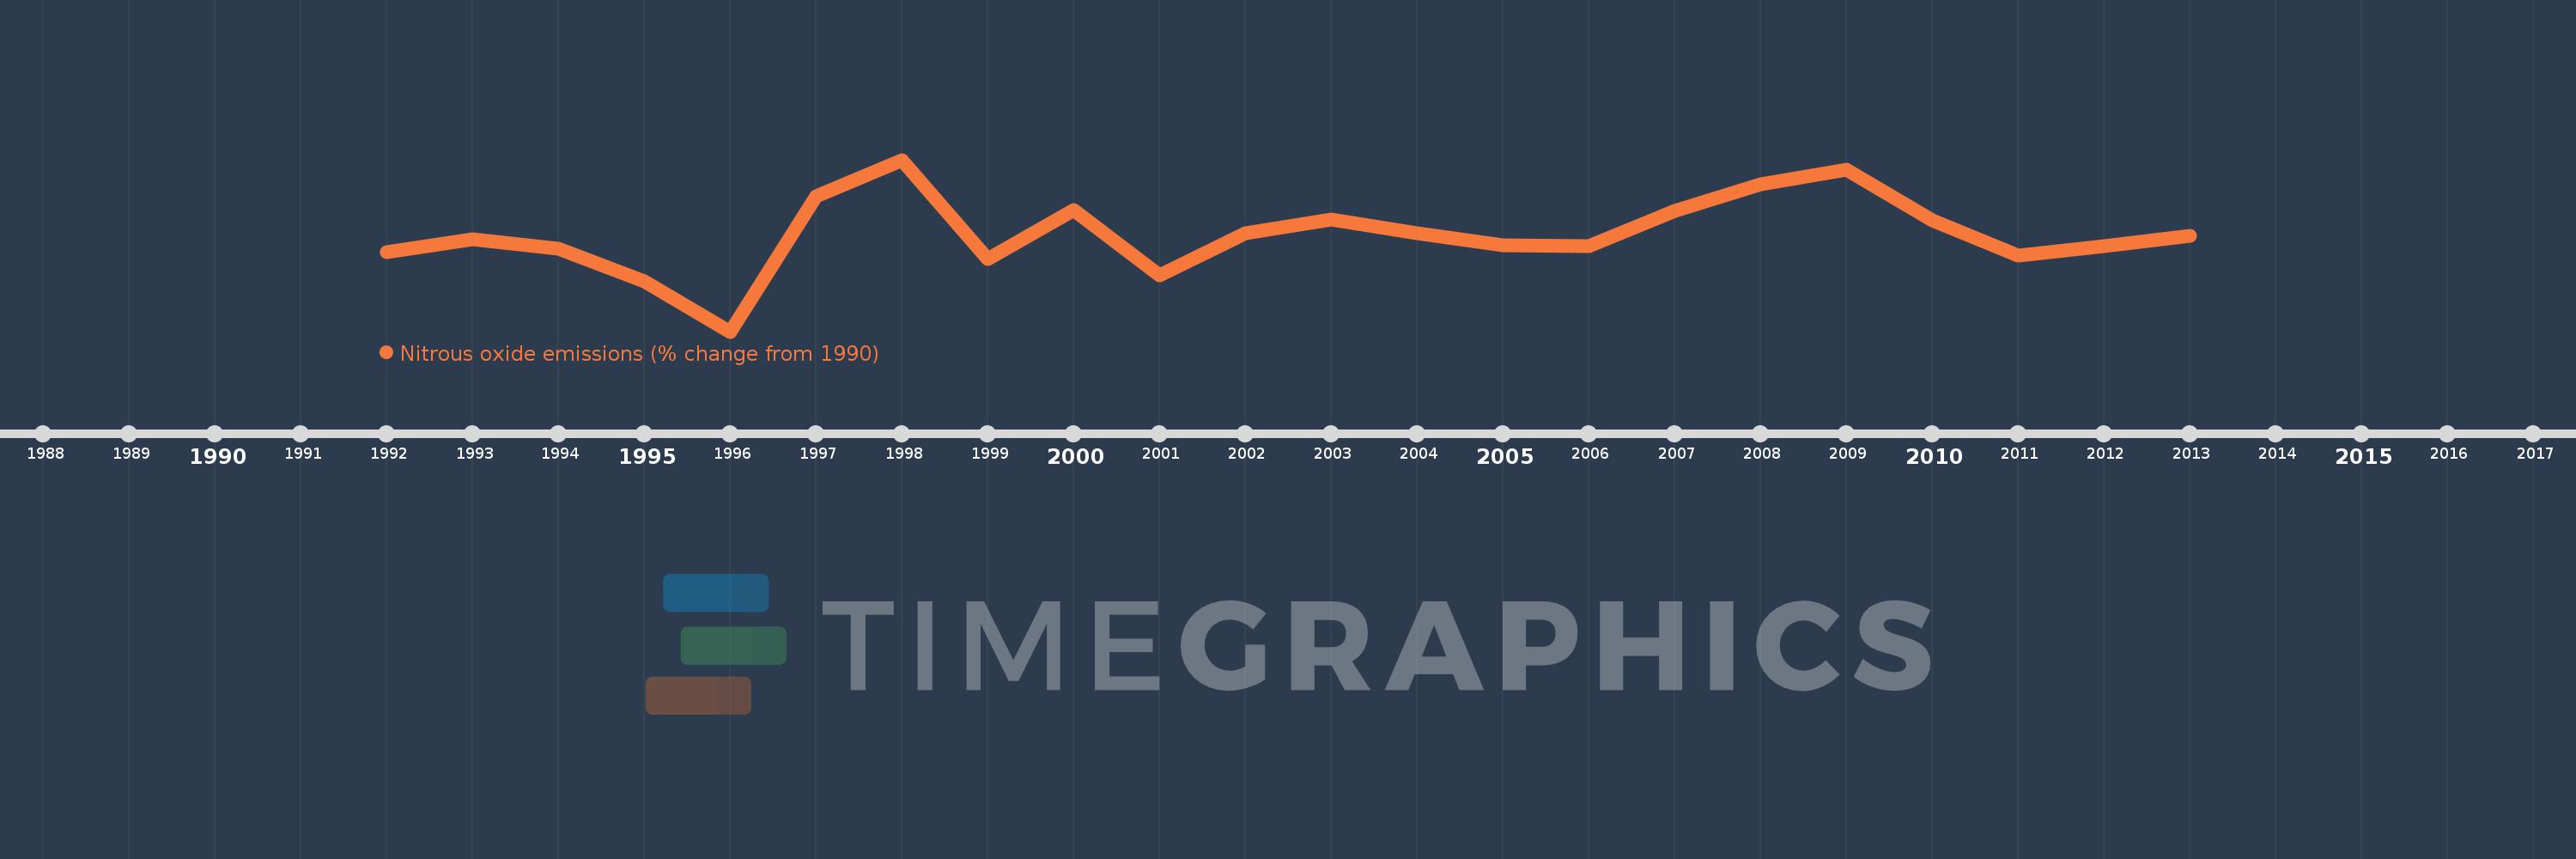
This timeline shows a graph from 1992 to 2013 of El Salvador. No data until 1991. Number of actual observations by date: 22.
Source name:
World Development Indicators
Source organization:
World Bank staff estimates from original source: European Commission, Joint Research Centre (JRC)/Netherlands Environmental Assessment Agency (PBL). Emission Database for Global Atmospheric Research (EDGAR): http://edgar.jrc.ec.europa.eu/.
Categories, topics:
Climate Change, Environment
Last updated:
apr 23, 2017
Indicators value changes by year
Meaning:
5.893
Minimum:
-4.235
jan 1, 1996
Maximum:
13.647
jan 1, 1998
At the date of observation
Value
Absolute change
Change from the previous value
jan 1, 1992
4.039
+4.039
0.0%
jan 1, 1993
5.338
+1.299
32.15%
jan 1, 1994
4.415
-0.923
-17.3%
jan 1, 1995
0.979
-3.435
-77.82%
jan 1, 1996
-4.235
-5.214
-532.54%
jan 1, 1997
9.853
+14.088
-332.68%
jan 1, 1998
13.647
+3.794
38.51%
jan 1, 1999
3.301
-10.346
-75.81%
jan 1, 2000
8.424
+5.123
155.16%
jan 1, 2001
1.662
-6.763
-80.28%
jan 1, 2002
6.029
+4.368
262.89%
jan 1, 2003
7.4
+1.371
22.74%
jan 1, 2004
5.984
-1.417
-19.14%
jan 1, 2005
4.775
-1.209
-20.2%
jan 1, 2006
4.63
-0.145
-3.03%
jan 1, 2007
8.287
+3.656
78.96%
jan 1, 2008
11.118
+2.831
34.17%
jan 1, 2009
12.582
+1.464
13.17%
jan 1, 2010
7.35
-5.232
-41.58%
jan 1, 2011
3.654
-3.696
-50.29%
jan 1, 2012
4.69
+1.037
28.37%
jan 1, 2013
5.727
+1.037
22.1%
Ranking of countries by current statistics by years