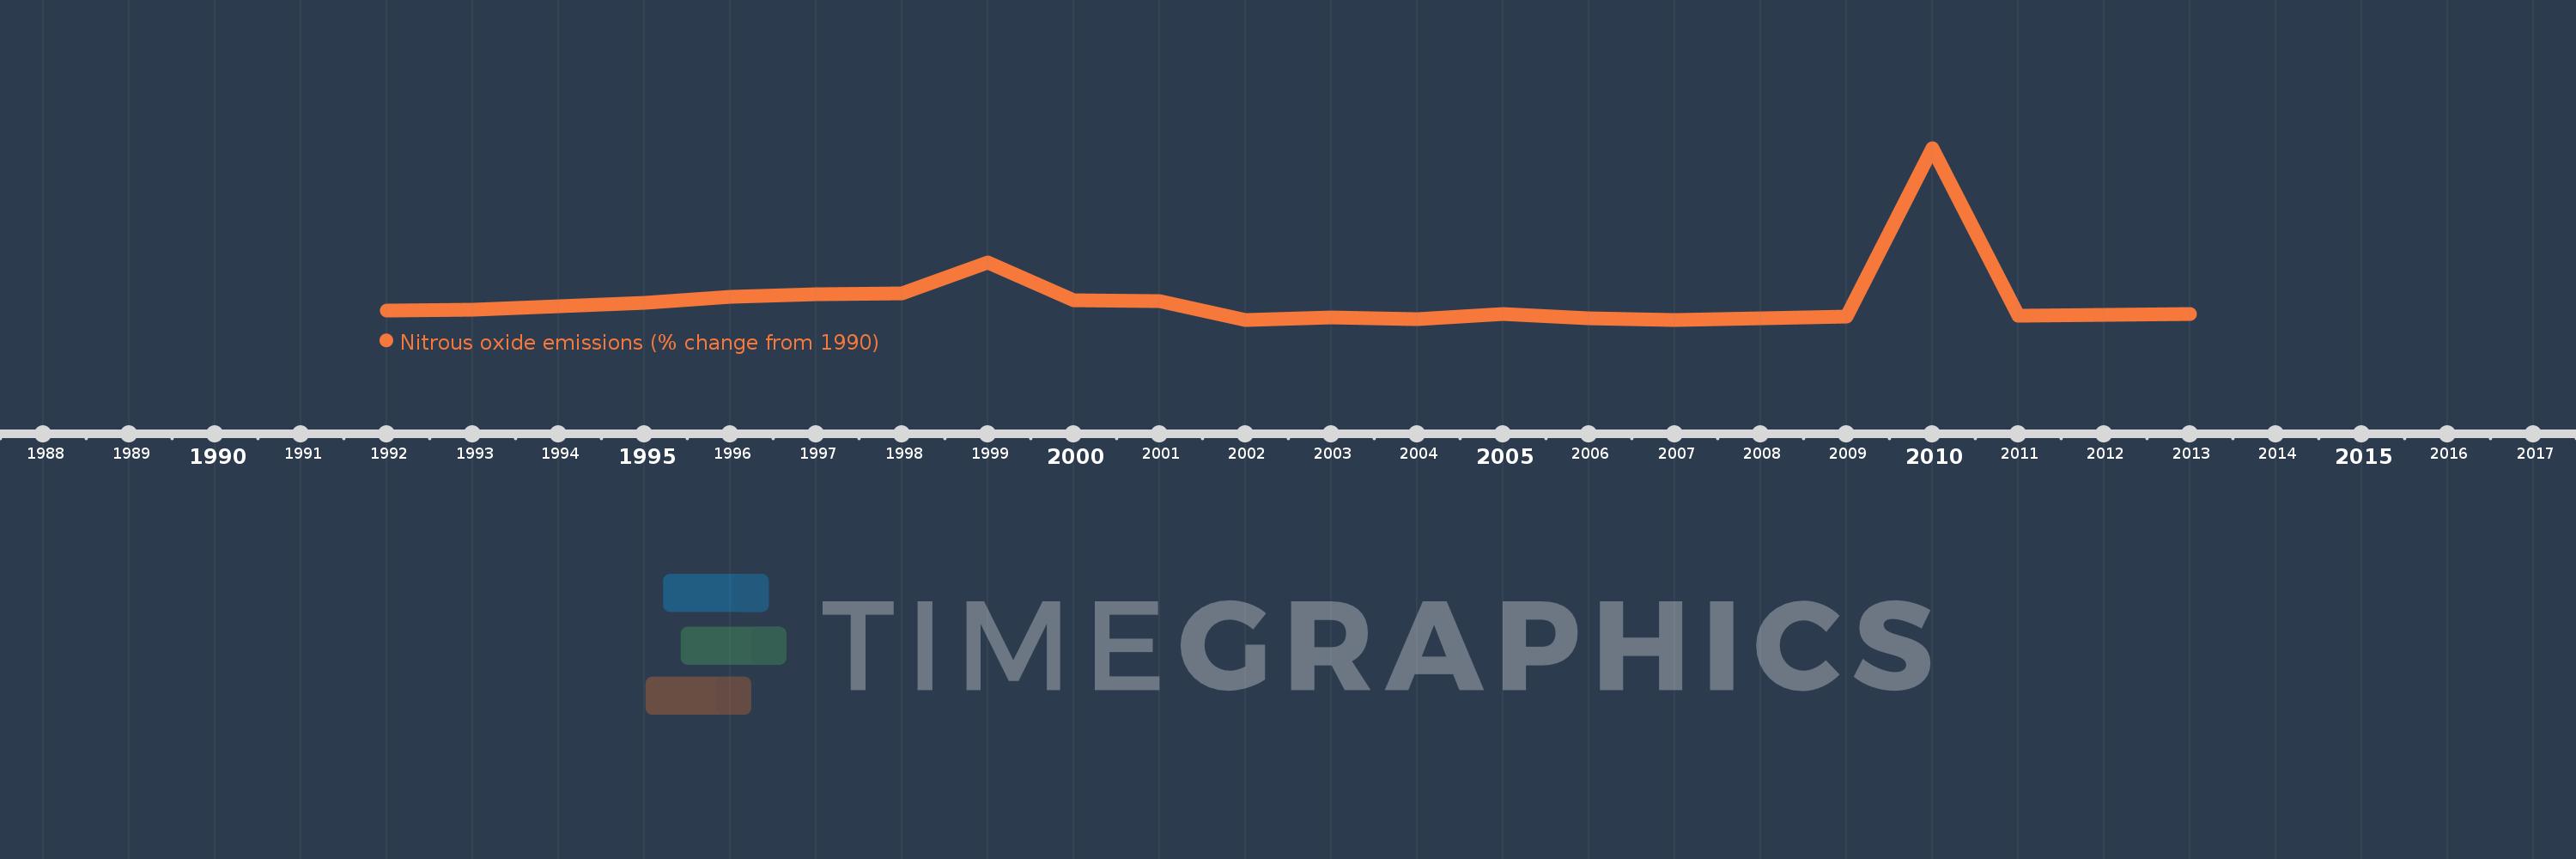
This timeline shows a graph from 1992 to 2013 of Caribbean small states. No data until 1991. Number of actual observations by date: 22.
Source name:
World Development Indicators
Source organization:
World Bank staff estimates from original source: European Commission, Joint Research Centre (JRC)/Netherlands Environmental Assessment Agency (PBL). Emission Database for Global Atmospheric Research (EDGAR): http://edgar.jrc.ec.europa.eu/.
Categories, topics:
Climate Change, Environment
Last updated:
apr 23, 2017
Indicators value changes by year
Meaning:
12.049
Minimum:
-8.251
jan 1, 2007
Maximum:
173.331
jan 1, 2010
At the date of observation
Value
Absolute change
Change from the previous value
jan 1, 1992
1.591
+1.591
0.0%
jan 1, 1993
2.652
+1.061
66.71%
jan 1, 1994
5.943
+3.291
124.07%
jan 1, 1995
9.255
+3.312
55.73%
jan 1, 1996
16.153
+6.899
74.54%
jan 1, 1997
18.509
+2.356
14.58%
jan 1, 1998
19.758
+1.249
6.75%
jan 1, 1999
51.873
+32.115
162.54%
jan 1, 2000
12.149
-39.724
-76.58%
jan 1, 2001
11.74
-0.409
-3.36%
jan 1, 2002
-8.24
-19.98
-170.19%
jan 1, 2003
-5.81
+2.43
-29.5%
jan 1, 2004
-7.261
-1.451
24.98%
jan 1, 2005
-2.385
+4.876
-67.15%
jan 1, 2006
-6.58
-4.195
175.9%
jan 1, 2007
-8.251
-1.672
25.41%
jan 1, 2008
-6.351
+1.901
-23.04%
jan 1, 2009
-4.69
+1.661
-26.15%
jan 1, 2010
173.331
+178.021
-3.8K%
jan 1, 2011
-3.736
-177.067
-102.16%
jan 1, 2012
-2.774
+0.963
-25.76%
jan 1, 2013
-1.811
+0.963
-34.71%
Ranking of countries by current statistics by years