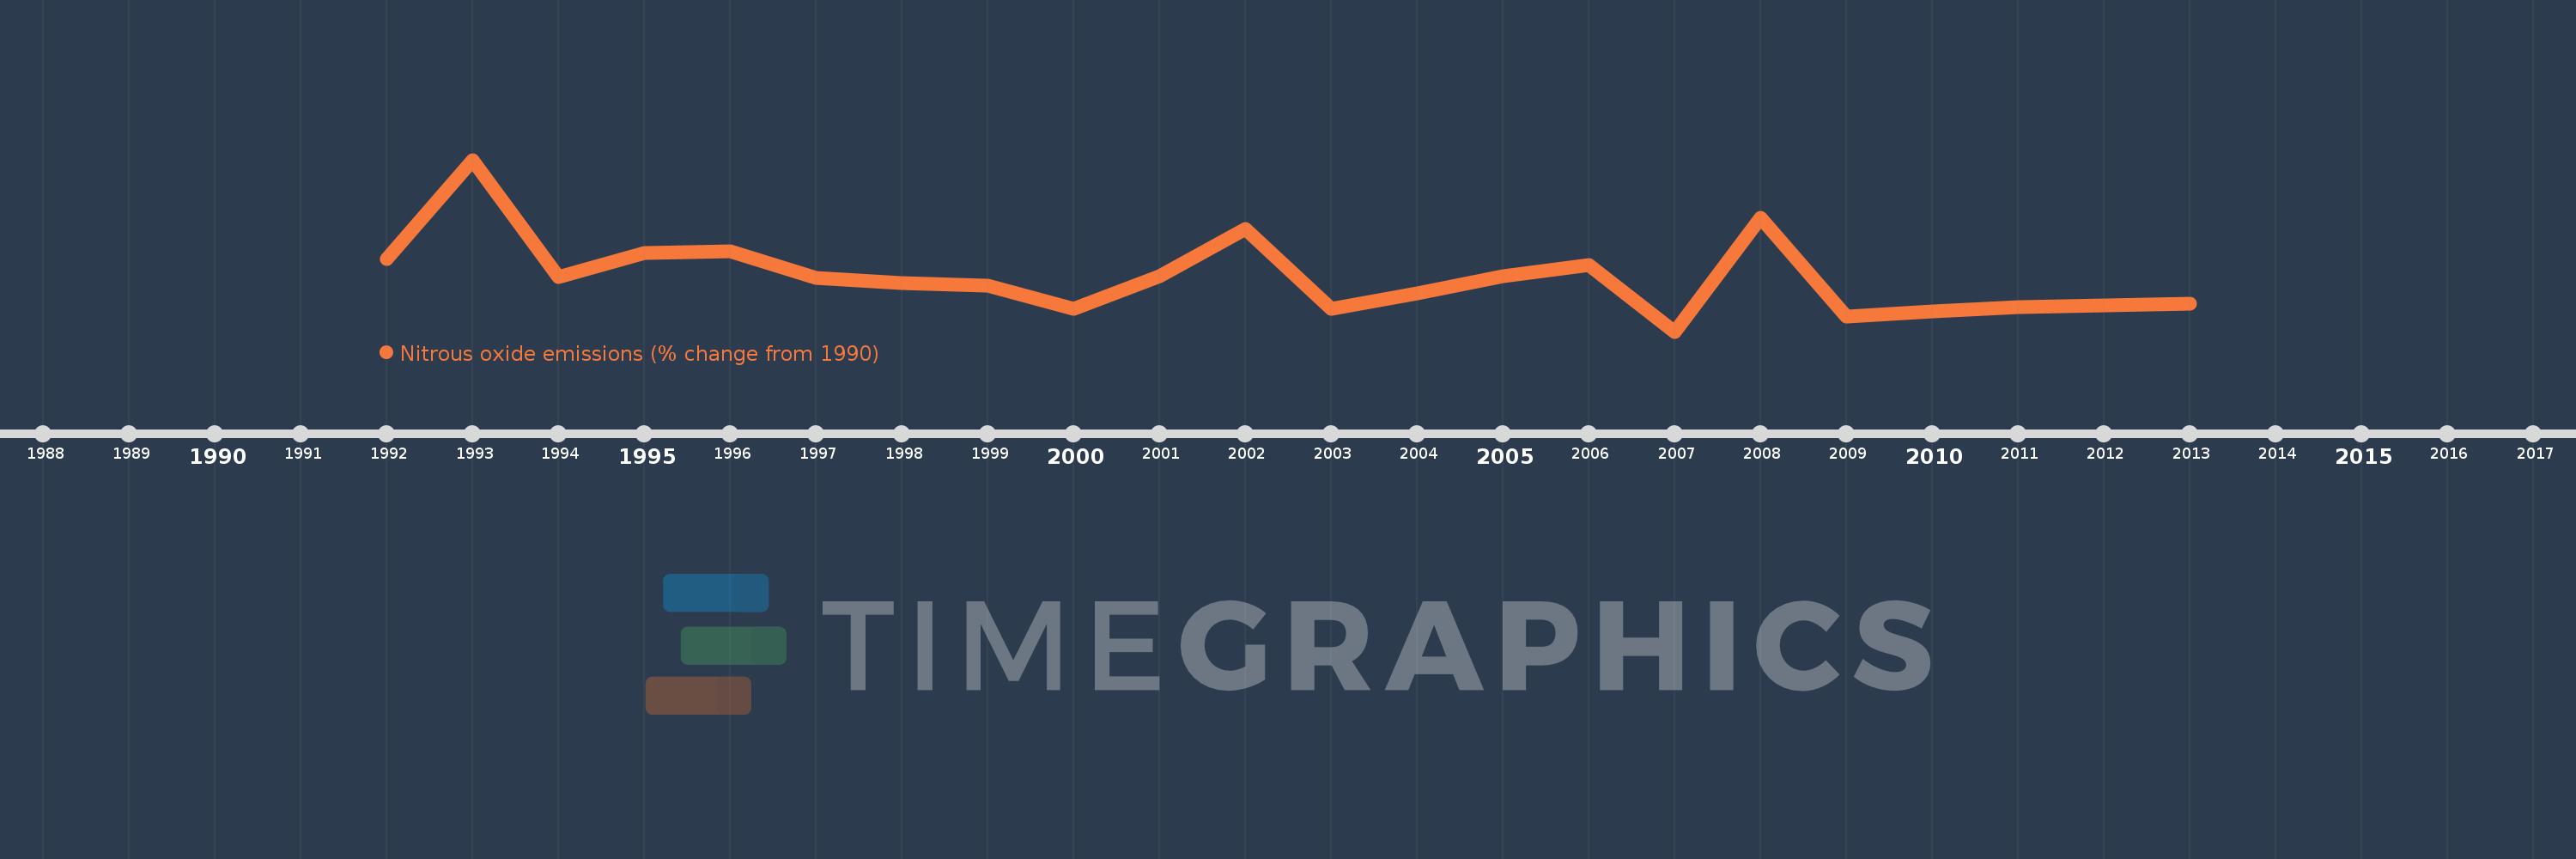
This timeline shows a graph from 1992 to 2013 of Congo, Rep.. No data until 1991. Number of actual observations by date: 22.
Source name:
World Development Indicators
Source organization:
World Bank staff estimates from original source: European Commission, Joint Research Centre (JRC)/Netherlands Environmental Assessment Agency (PBL). Emission Database for Global Atmospheric Research (EDGAR): http://edgar.jrc.ec.europa.eu/.
Categories, topics:
Climate Change, Environment
Last updated:
apr 23, 2017
Indicators value changes by year
Meaning:
-21.824
Minimum:
-42.972
jan 1, 2007
Maximum:
23.776
jan 1, 1993
At the date of observation
Value
Absolute change
Change from the previous value
jan 1, 1992
-14.906
-14.906
0.0%
jan 1, 1993
23.776
+38.681
-259.51%
jan 1, 1994
-21.634
-45.41
-190.99%
jan 1, 1995
-12.443
+9.191
-42.49%
jan 1, 1996
-11.747
+0.696
-5.59%
jan 1, 1997
-22.076
-10.329
87.93%
jan 1, 1998
-23.971
-1.895
8.58%
jan 1, 1999
-25.094
-1.123
4.68%
jan 1, 2000
-34.18
-9.086
36.21%
jan 1, 2001
-21.447
+12.733
-37.25%
jan 1, 2002
-3.193
+18.254
-85.11%
jan 1, 2003
-34.294
-31.101
974.04%
jan 1, 2004
-28.057
+6.237
-18.19%
jan 1, 2005
-21.515
+6.543
-23.32%
jan 1, 2006
-17.187
+4.327
-20.11%
jan 1, 2007
-42.972
-25.785
150.02%
jan 1, 2008
1.141
+44.113
-102.66%
jan 1, 2009
-37.13
-38.271
-3.35K%
jan 1, 2010
-35.091
+2.039
-5.49%
jan 1, 2011
-33.37
+1.72
-4.9%
jan 1, 2012
-32.704
+0.666
-2.0%
jan 1, 2013
-32.038
+0.666
-2.04%
Ranking of countries by current statistics by years