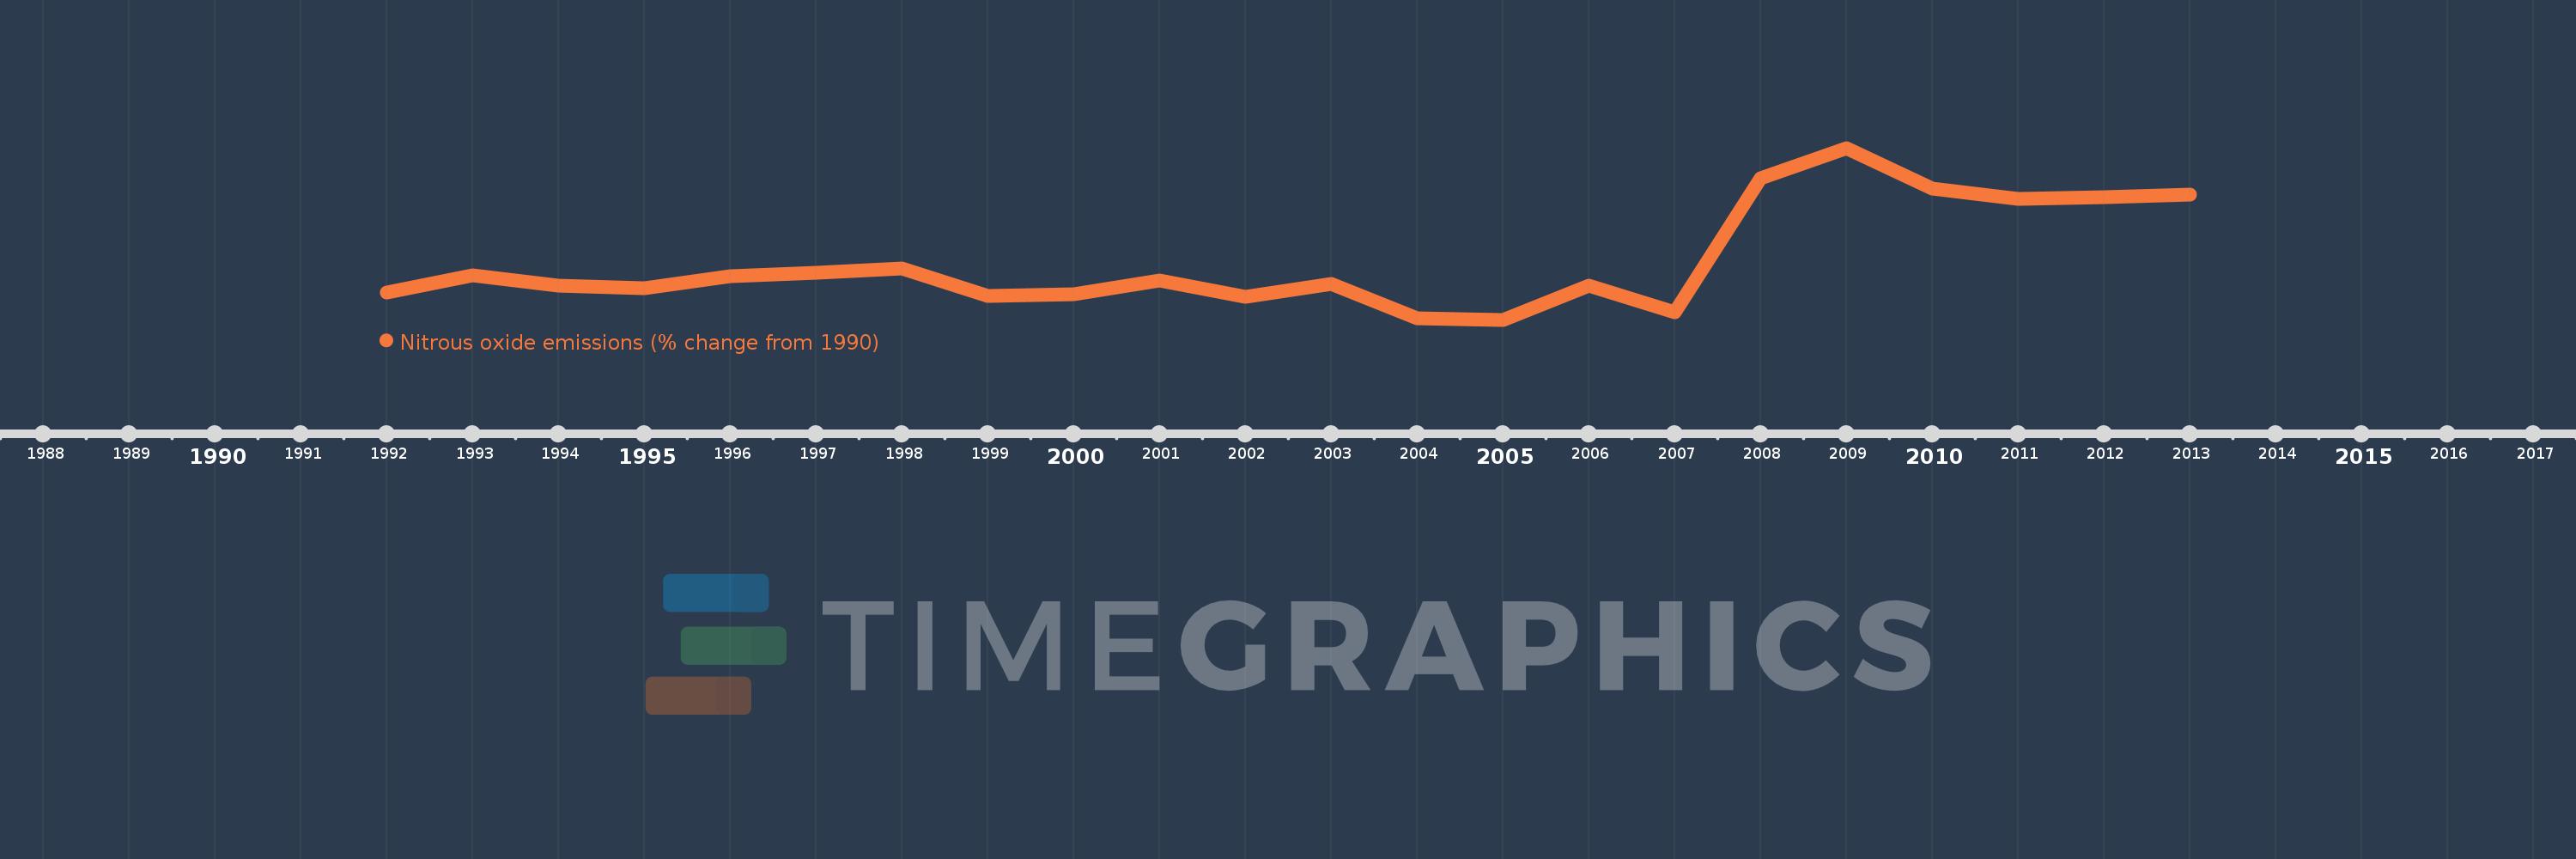
This timeline shows a graph from 1992 to 2013 of Togo. No data until 1991. Number of actual observations by date: 22.
Source name:
World Development Indicators
Source organization:
World Bank staff estimates from original source: European Commission, Joint Research Centre (JRC)/Netherlands Environmental Assessment Agency (PBL). Emission Database for Global Atmospheric Research (EDGAR): http://edgar.jrc.ec.europa.eu/.
Categories, topics:
Climate Change, Environment
Last updated:
apr 23, 2017
Indicators value changes by year
Meaning:
-4.372
Minimum:
-43.063
jan 1, 2005
Maximum:
70.943
jan 1, 2009
At the date of observation
Value
Absolute change
Change from the previous value
jan 1, 1992
-25.272
-25.272
0.0%
jan 1, 1993
-13.353
+11.92
-47.16%
jan 1, 1994
-20.564
-7.211
54.01%
jan 1, 1995
-21.989
-1.424
6.93%
jan 1, 1996
-13.886
+8.103
-36.85%
jan 1, 1997
-12.069
+1.816
-13.08%
jan 1, 1998
-8.981
+3.089
-25.59%
jan 1, 1999
-27.533
-18.552
206.58%
jan 1, 2000
-26.203
+1.33
-4.83%
jan 1, 2001
-17.1
+9.103
-34.74%
jan 1, 2002
-27.982
-10.882
63.64%
jan 1, 2003
-19.191
+8.791
-31.42%
jan 1, 2004
-41.94
-22.749
118.55%
jan 1, 2005
-43.063
-1.123
2.68%
jan 1, 2006
-20.188
+22.875
-53.12%
jan 1, 2007
-37.863
-17.675
87.55%
jan 1, 2008
50.603
+88.466
-233.65%
jan 1, 2009
70.943
+20.341
40.2%
jan 1, 2010
43.972
-26.971
-38.02%
jan 1, 2011
37.123
-6.849
-15.58%
jan 1, 2012
38.494
+1.371
3.69%
jan 1, 2013
39.866
+1.371
3.56%
Ranking of countries by current statistics by years