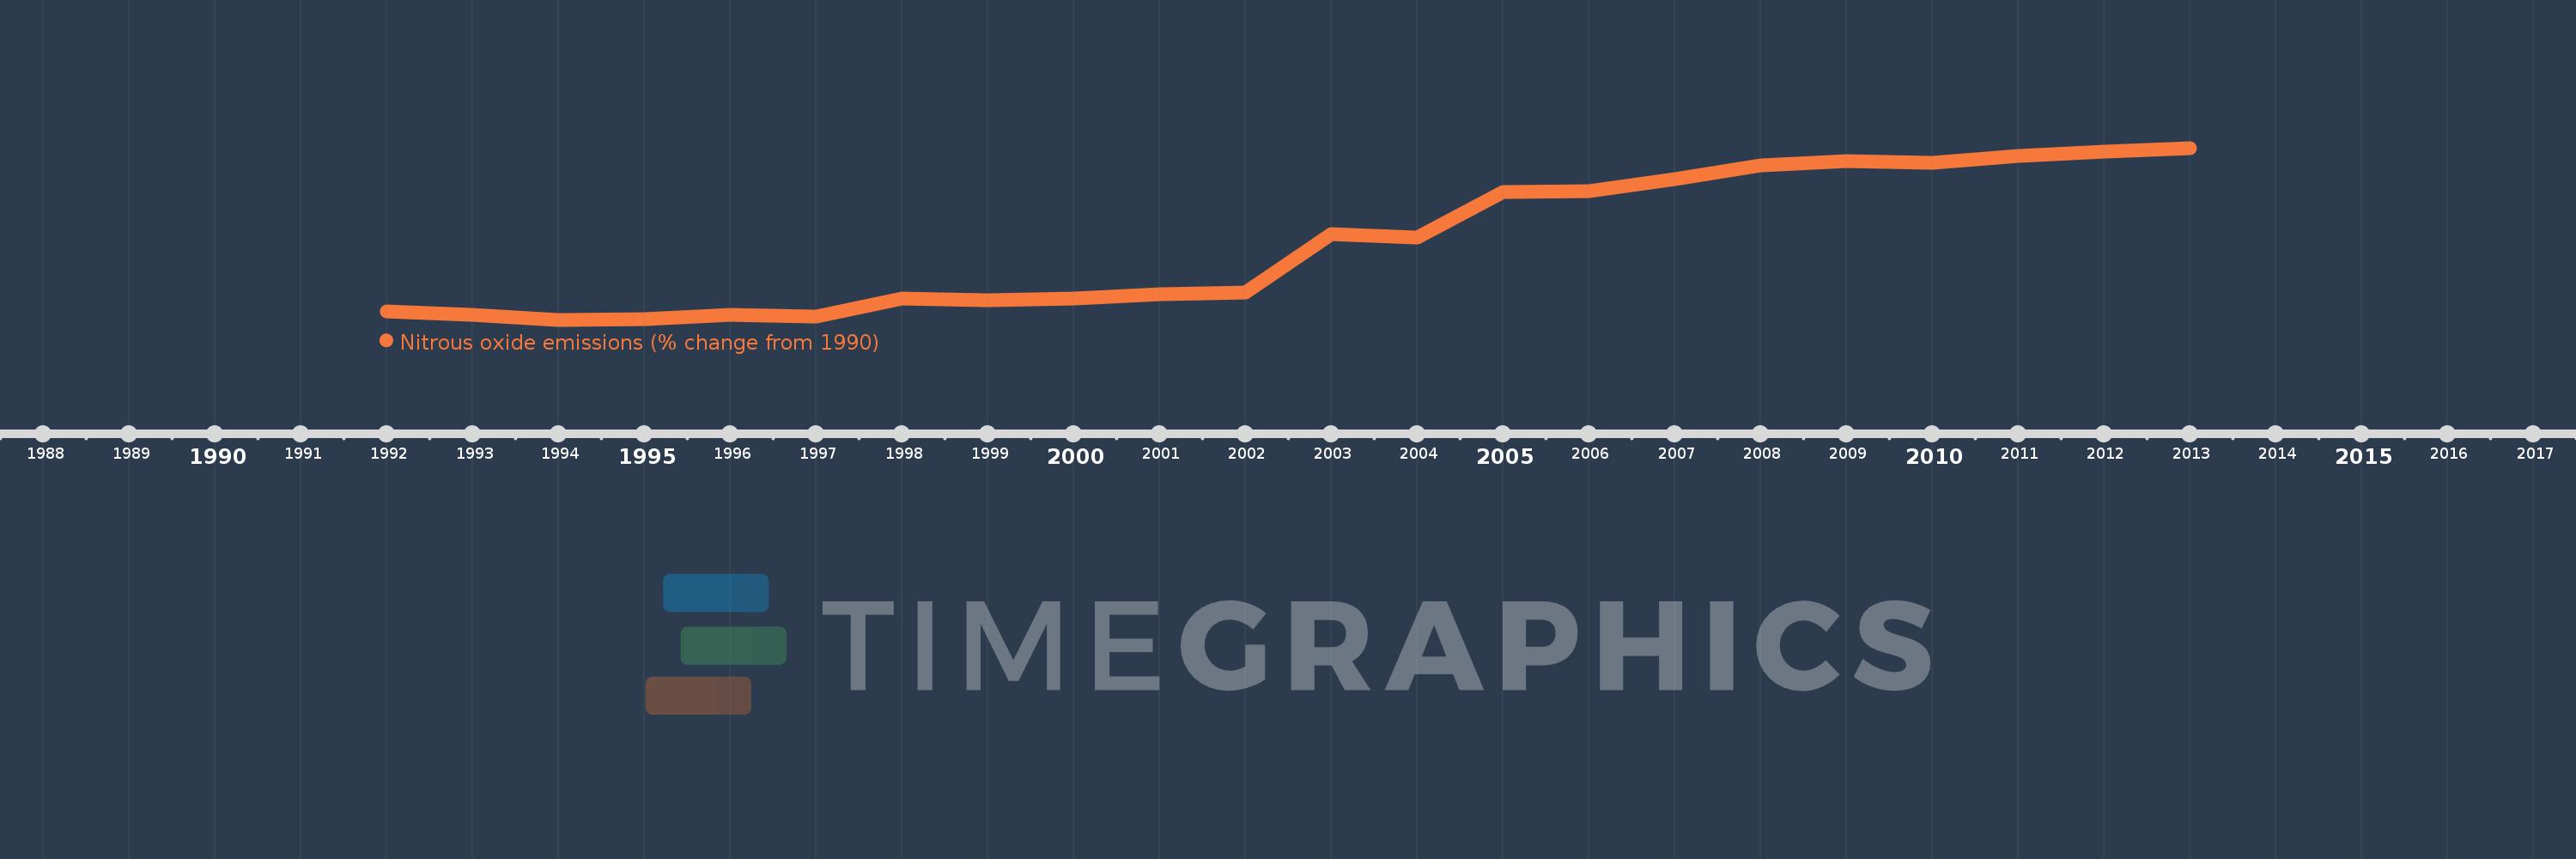
This timeline shows a graph from 1992 to 2013 of Seychelles. No data until 1991. Number of actual observations by date: 22.
Source name:
World Development Indicators
Source organization:
World Bank staff estimates from original source: European Commission, Joint Research Centre (JRC)/Netherlands Environmental Assessment Agency (PBL). Emission Database for Global Atmospheric Research (EDGAR): http://edgar.jrc.ec.europa.eu/.
Categories, topics:
Climate Change, Environment
Last updated:
apr 23, 2017
Indicators value changes by year
Meaning:
31.999
Minimum:
-0.179
jan 1, 1994
Maximum:
72.472
jan 1, 2013
At the date of observation
Value
Absolute change
Change from the previous value
jan 1, 1992
3.394
+3.394
0.0%
jan 1, 1993
1.948
-1.446
-42.6%
jan 1, 1994
-0.179
-2.127
-109.19%
jan 1, 1995
0.029
+0.208
-116.38%
jan 1, 1996
1.86
+1.83
6.24K%
jan 1, 1997
1.257
-0.603
-32.41%
jan 1, 1998
8.654
+7.397
588.48%
jan 1, 1999
7.886
-0.768
-8.87%
jan 1, 2000
8.715
+0.829
10.51%
jan 1, 2001
10.475
+1.76
20.2%
jan 1, 2002
11.448
+0.973
9.29%
jan 1, 2003
36.021
+24.573
214.64%
jan 1, 2004
34.497
-1.524
-4.23%
jan 1, 2005
53.767
+19.27
55.86%
jan 1, 2006
54.247
+0.48
0.89%
jan 1, 2007
59.234
+4.987
9.19%
jan 1, 2008
65.173
+5.938
10.03%
jan 1, 2009
67.003
+1.83
2.81%
jan 1, 2010
66.201
-0.802
-1.2%
jan 1, 2011
69.09
+2.89
4.36%
jan 1, 2012
70.781
+1.691
2.45%
jan 1, 2013
72.472
+1.691
2.39%
Ranking of countries by current statistics by years