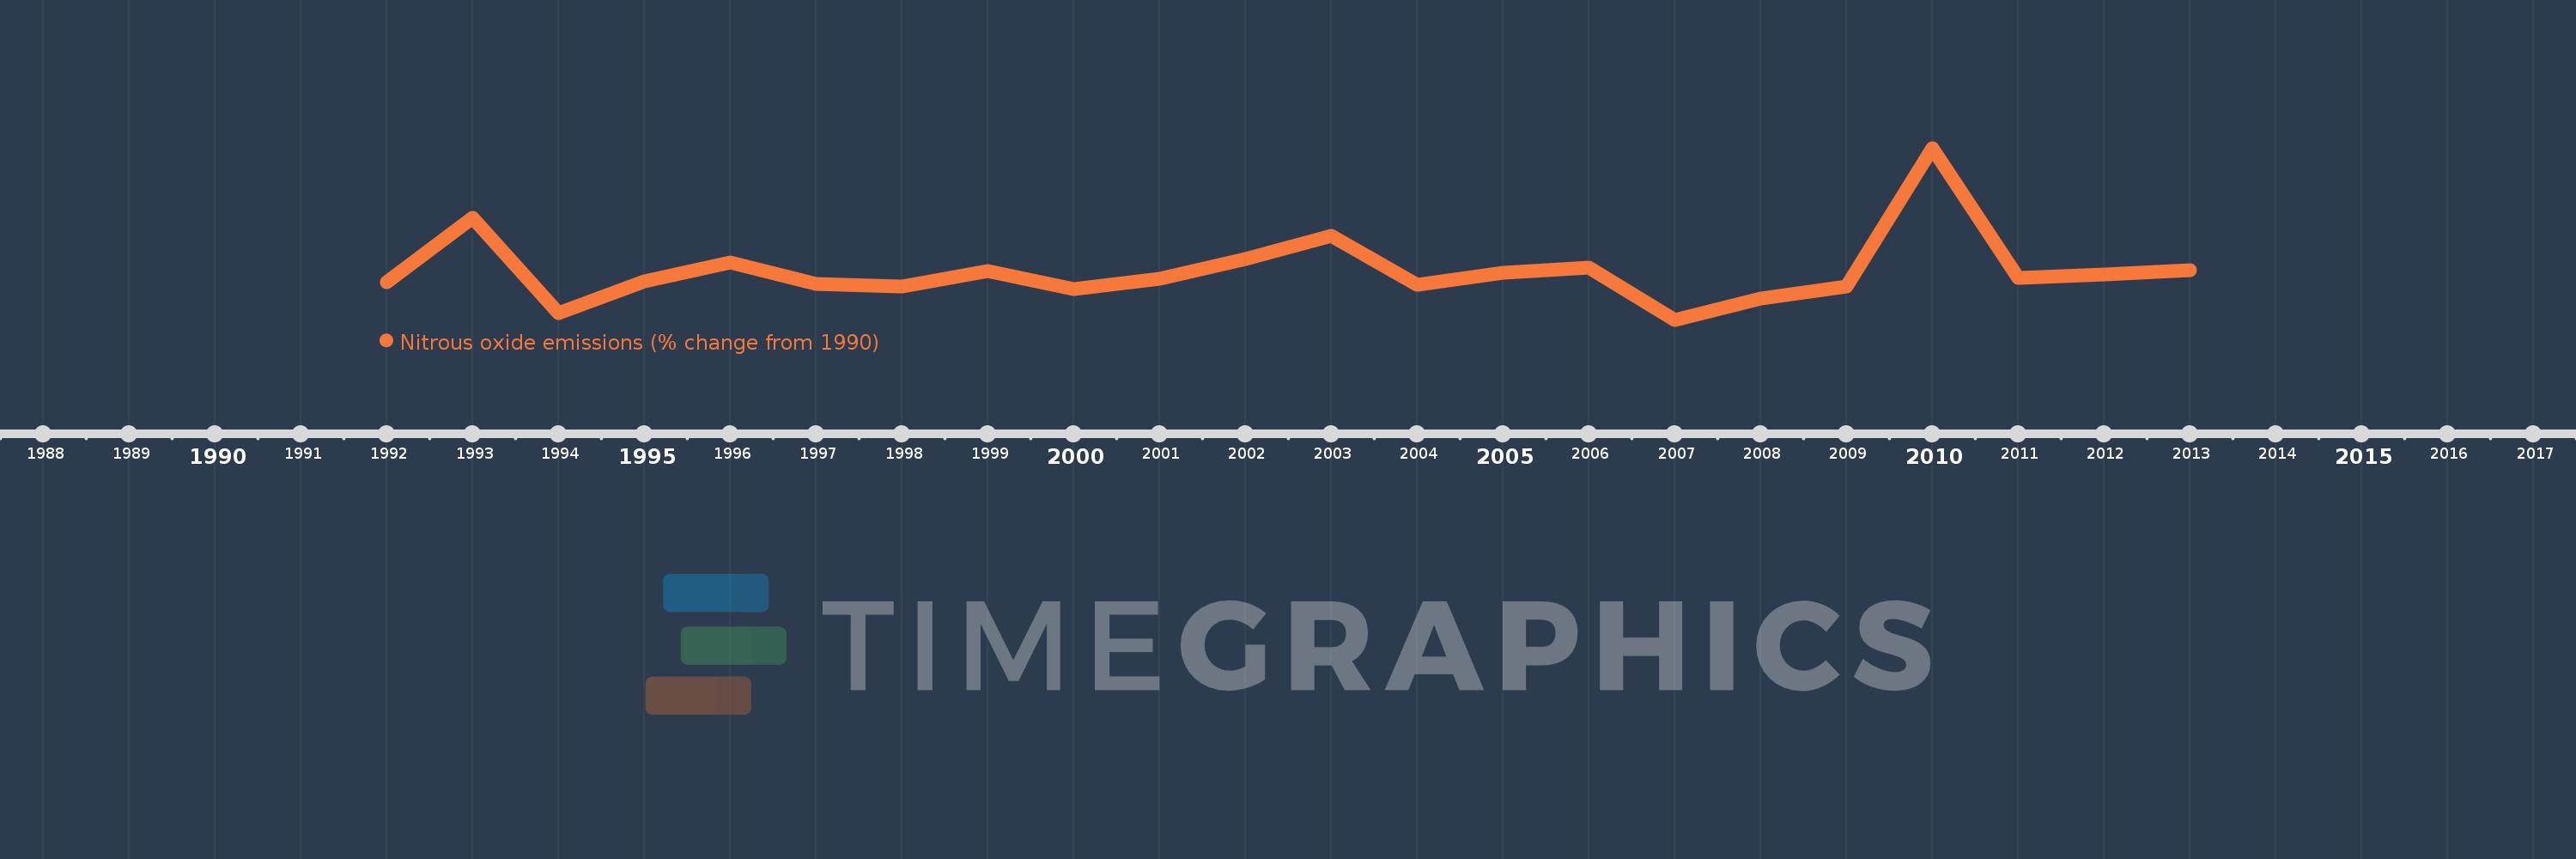
This timeline shows a graph from 1992 to 2013 of Small states. No data until 1991. Number of actual observations by date: 22.
Source name:
World Development Indicators
Source organization:
World Bank staff estimates from original source: European Commission, Joint Research Centre (JRC)/Netherlands Environmental Assessment Agency (PBL). Emission Database for Global Atmospheric Research (EDGAR): http://edgar.jrc.ec.europa.eu/.
Categories, topics:
Climate Change, Environment
Last updated:
apr 23, 2017
Indicators value changes by year
Meaning:
-10.625
Minimum:
-22.466
jan 1, 2007
Maximum:
19.231
jan 1, 2010
At the date of observation
Value
Absolute change
Change from the previous value
jan 1, 1992
-13.304
-13.304
0.0%
jan 1, 1993
2.373
+15.677
-117.84%
jan 1, 1994
-20.936
-23.309
-982.31%
jan 1, 1995
-13.156
+7.779
-37.16%
jan 1, 1996
-8.598
+4.558
-34.65%
jan 1, 1997
-13.796
-5.198
60.45%
jan 1, 1998
-14.399
-0.603
4.37%
jan 1, 1999
-10.658
+3.742
-25.98%
jan 1, 2000
-15.064
-4.406
41.34%
jan 1, 2001
-12.557
+2.507
-16.64%
jan 1, 2002
-7.707
+4.85
-38.62%
jan 1, 2003
-2.03
+5.677
-73.66%
jan 1, 2004
-13.937
-11.907
586.54%
jan 1, 2005
-11.086
+2.851
-20.46%
jan 1, 2006
-9.76
+1.326
-11.96%
jan 1, 2007
-22.466
-12.706
130.18%
jan 1, 2008
-17.39
+5.076
-22.59%
jan 1, 2009
-14.339
+3.051
-17.54%
jan 1, 2010
19.231
+33.57
-234.11%
jan 1, 2011
-12.266
-31.497
-163.78%
jan 1, 2012
-11.388
+0.877
-7.15%
jan 1, 2013
-10.511
+0.877
-7.7%
Ranking of countries by current statistics by years