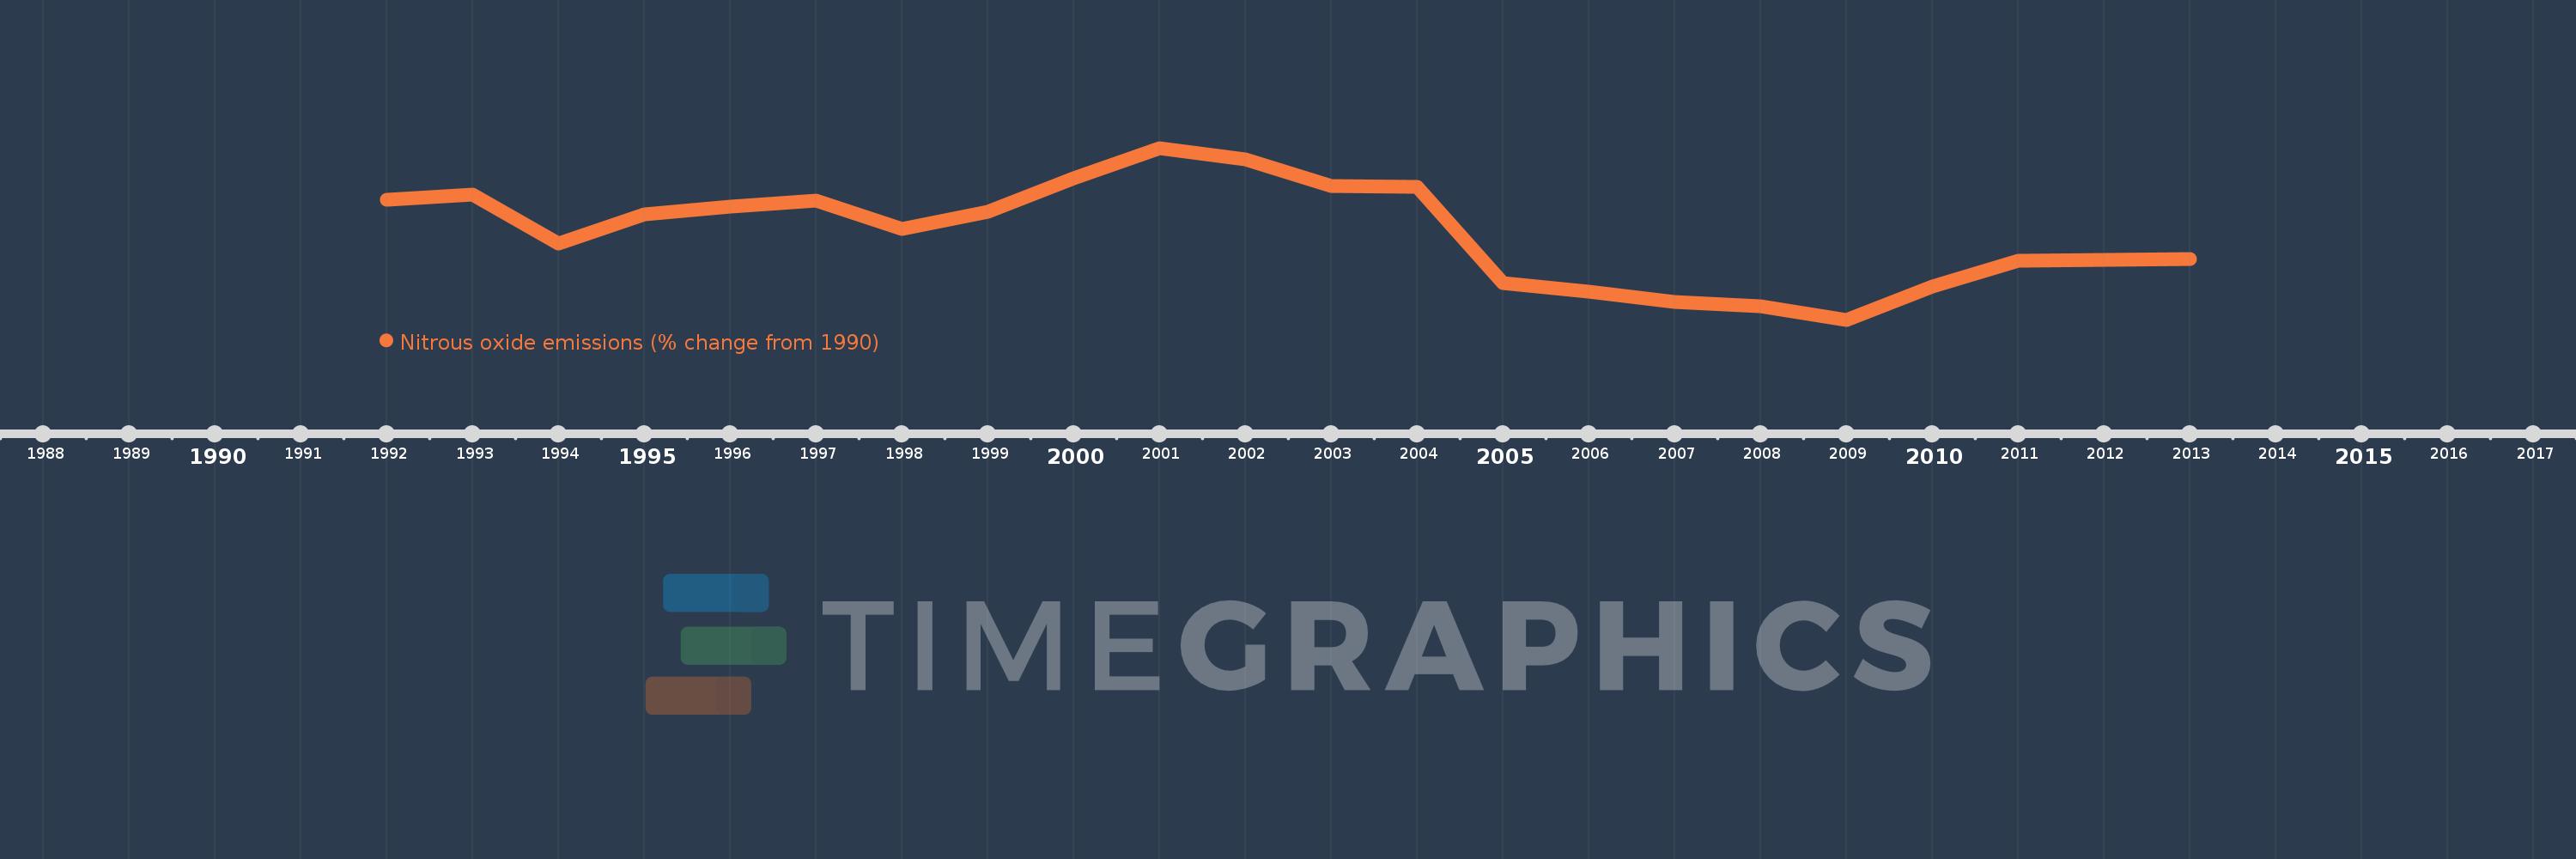
This timeline shows a graph from 1992 to 2013 of Czech Republic. No data until 1991. Number of actual observations by date: 22.
Source name:
World Development Indicators
Source organization:
World Bank staff estimates from original source: European Commission, Joint Research Centre (JRC)/Netherlands Environmental Assessment Agency (PBL). Emission Database for Global Atmospheric Research (EDGAR): http://edgar.jrc.ec.europa.eu/.
Categories, topics:
Climate Change, Environment
Last updated:
apr 23, 2017
Indicators value changes by year
Meaning:
-21.675
Minimum:
-38.923
jan 1, 2009
Maximum:
-4.755
jan 1, 2001
At the date of observation
Value
Absolute change
Change from the previous value
jan 1, 1992
-15.015
-15.015
0.0%
jan 1, 1993
-14.028
+0.987
-6.57%
jan 1, 1994
-23.725
-9.697
69.13%
jan 1, 1995
-17.908
+5.817
-24.52%
jan 1, 1996
-16.4
+1.507
-8.42%
jan 1, 1997
-15.178
+1.222
-7.45%
jan 1, 1998
-20.816
-5.638
37.14%
jan 1, 1999
-17.514
+3.302
-15.86%
jan 1, 2000
-10.808
+6.706
-38.29%
jan 1, 2001
-4.755
+6.053
-56.0%
jan 1, 2002
-7.063
-2.308
48.53%
jan 1, 2003
-12.301
-5.238
74.17%
jan 1, 2004
-12.518
-0.218
1.77%
jan 1, 2005
-31.657
-19.139
152.89%
jan 1, 2006
-33.269
-1.611
5.09%
jan 1, 2007
-35.414
-2.145
6.45%
jan 1, 2008
-36.221
-0.807
2.28%
jan 1, 2009
-38.923
-2.703
7.46%
jan 1, 2010
-32.229
+6.695
-17.2%
jan 1, 2011
-27.164
+5.065
-15.71%
jan 1, 2012
-27.039
+0.125
-0.46%
jan 1, 2013
-26.914
+0.125
-0.46%
Ranking of countries by current statistics by years