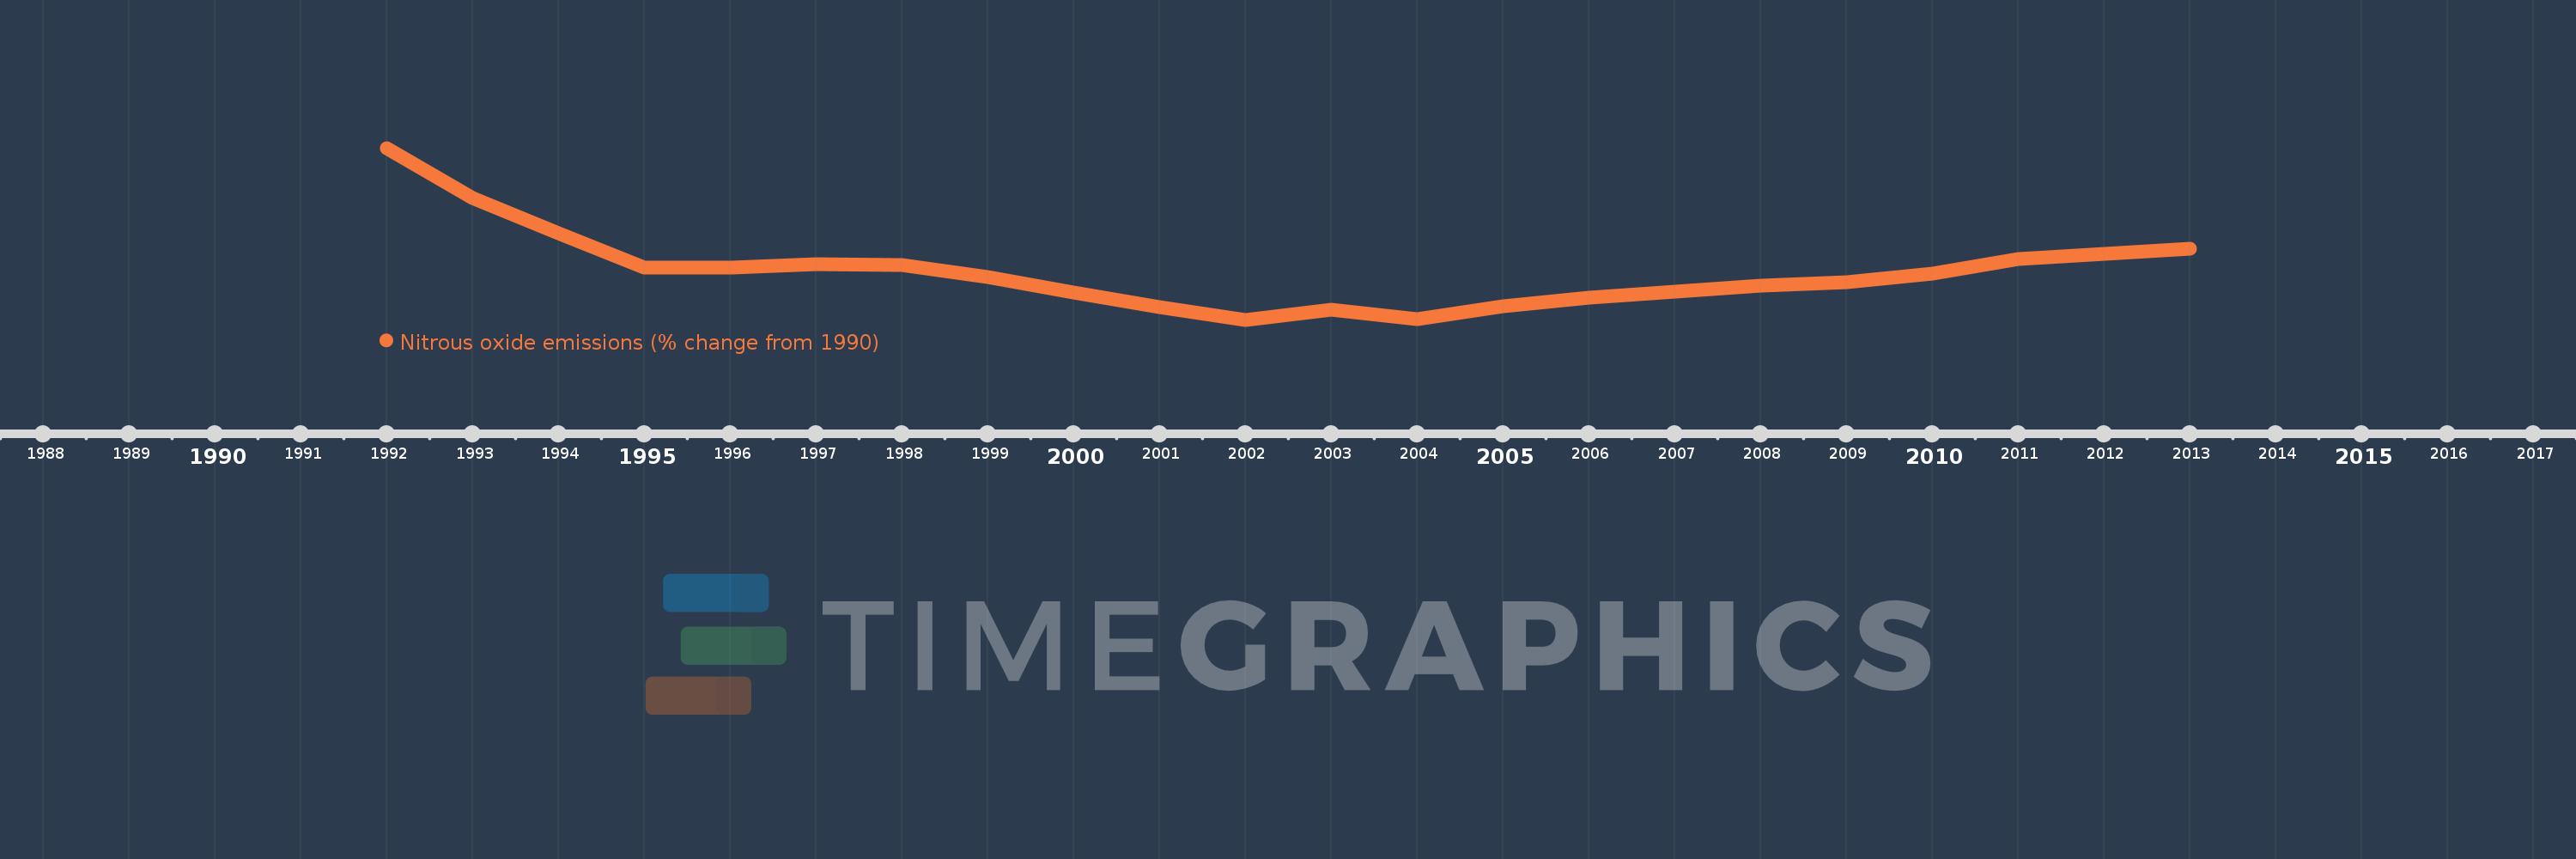
This timeline shows a graph from 1992 to 2013 of Belarus. No data until 1991. Number of actual observations by date: 22.
Source name:
World Development Indicators
Source organization:
World Bank staff estimates from original source: European Commission, Joint Research Centre (JRC)/Netherlands Environmental Assessment Agency (PBL). Emission Database for Global Atmospheric Research (EDGAR): http://edgar.jrc.ec.europa.eu/.
Categories, topics:
Climate Change, Environment
Last updated:
apr 23, 2017
Indicators value changes by year
Meaning:
-35.642
Minimum:
-45.652
jan 1, 2002
Maximum:
-10.215
jan 1, 1992
At the date of observation
Value
Absolute change
Change from the previous value
jan 1, 1992
-10.215
-10.215
0.0%
jan 1, 1993
-20.549
-10.334
101.17%
jan 1, 1994
-27.865
-7.316
35.6%
jan 1, 1995
-34.827
-6.962
24.99%
jan 1, 1996
-34.908
-0.081
0.23%
jan 1, 1997
-34.161
+0.748
-2.14%
jan 1, 1998
-34.291
-0.13
0.38%
jan 1, 1999
-36.913
-2.623
7.65%
jan 1, 2000
-39.991
-3.077
8.34%
jan 1, 2001
-43.068
-3.077
7.7%
jan 1, 2002
-45.652
-2.584
6.0%
jan 1, 2003
-43.518
+2.134
-4.68%
jan 1, 2004
-45.562
-2.044
4.7%
jan 1, 2005
-42.881
+2.681
-5.88%
jan 1, 2006
-41.119
+1.762
-4.11%
jan 1, 2007
-39.921
+1.198
-2.91%
jan 1, 2008
-38.553
+1.368
-3.43%
jan 1, 2009
-37.864
+0.689
-1.79%
jan 1, 2010
-36.116
+1.749
-4.62%
jan 1, 2011
-33.125
+2.991
-8.28%
jan 1, 2012
-32.053
+1.072
-3.24%
jan 1, 2013
-30.981
+1.072
-3.34%
Ranking of countries by current statistics by years