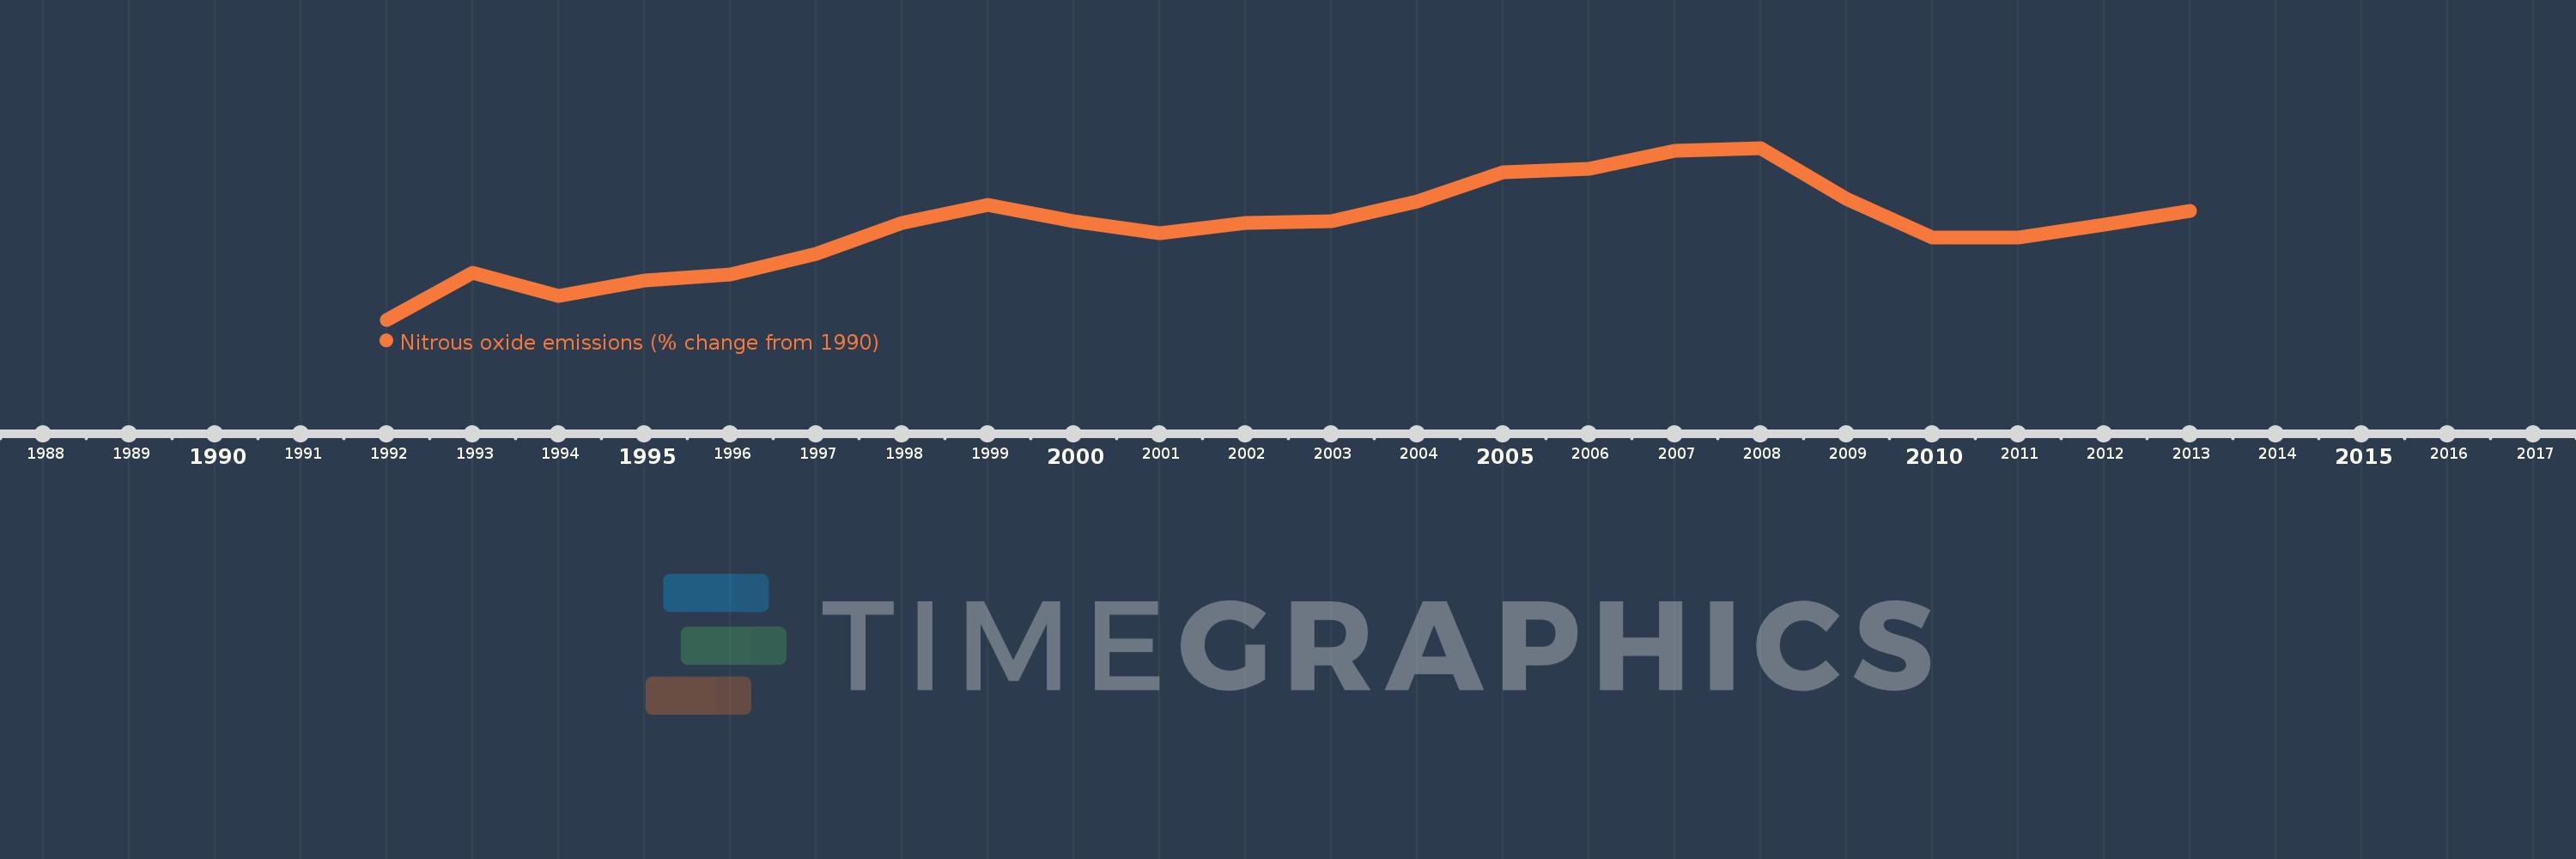
This timeline shows a graph from 1992 to 2013 of Iran, Islamic Rep.. No data until 1991. Number of actual observations by date: 22.
Source name:
World Development Indicators
Source organization:
World Bank staff estimates from original source: European Commission, Joint Research Centre (JRC)/Netherlands Environmental Assessment Agency (PBL). Emission Database for Global Atmospheric Research (EDGAR): http://edgar.jrc.ec.europa.eu/.
Categories, topics:
Climate Change, Environment
Last updated:
apr 23, 2017
Indicators value changes by year
Meaning:
26.867
Minimum:
4.317
jan 1, 1992
Maximum:
45.732
jan 1, 2008
At the date of observation
Value
Absolute change
Change from the previous value
jan 1, 1992
4.317
+4.317
0.0%
jan 1, 1993
15.545
+11.229
260.12%
jan 1, 1994
9.973
-5.572
-35.85%
jan 1, 1995
13.738
+3.765
37.75%
jan 1, 1996
15.137
+1.4
10.19%
jan 1, 1997
20.12
+4.983
32.92%
jan 1, 1998
27.599
+7.479
37.17%
jan 1, 1999
32.013
+4.414
15.99%
jan 1, 2000
28.015
-3.997
-12.49%
jan 1, 2001
25.26
-2.756
-9.84%
jan 1, 2002
27.661
+2.401
9.5%
jan 1, 2003
28.048
+0.388
1.4%
jan 1, 2004
32.746
+4.698
16.75%
jan 1, 2005
39.865
+7.119
21.74%
jan 1, 2006
40.78
+0.915
2.3%
jan 1, 2007
45.018
+4.238
10.39%
jan 1, 2008
45.732
+0.714
1.59%
jan 1, 2009
33.474
-12.258
-26.8%
jan 1, 2010
24.224
-9.25
-27.63%
jan 1, 2011
24.048
-0.176
-0.73%
jan 1, 2012
27.273
+3.225
13.41%
jan 1, 2013
30.498
+3.225
11.83%
Ranking of countries by current statistics by years