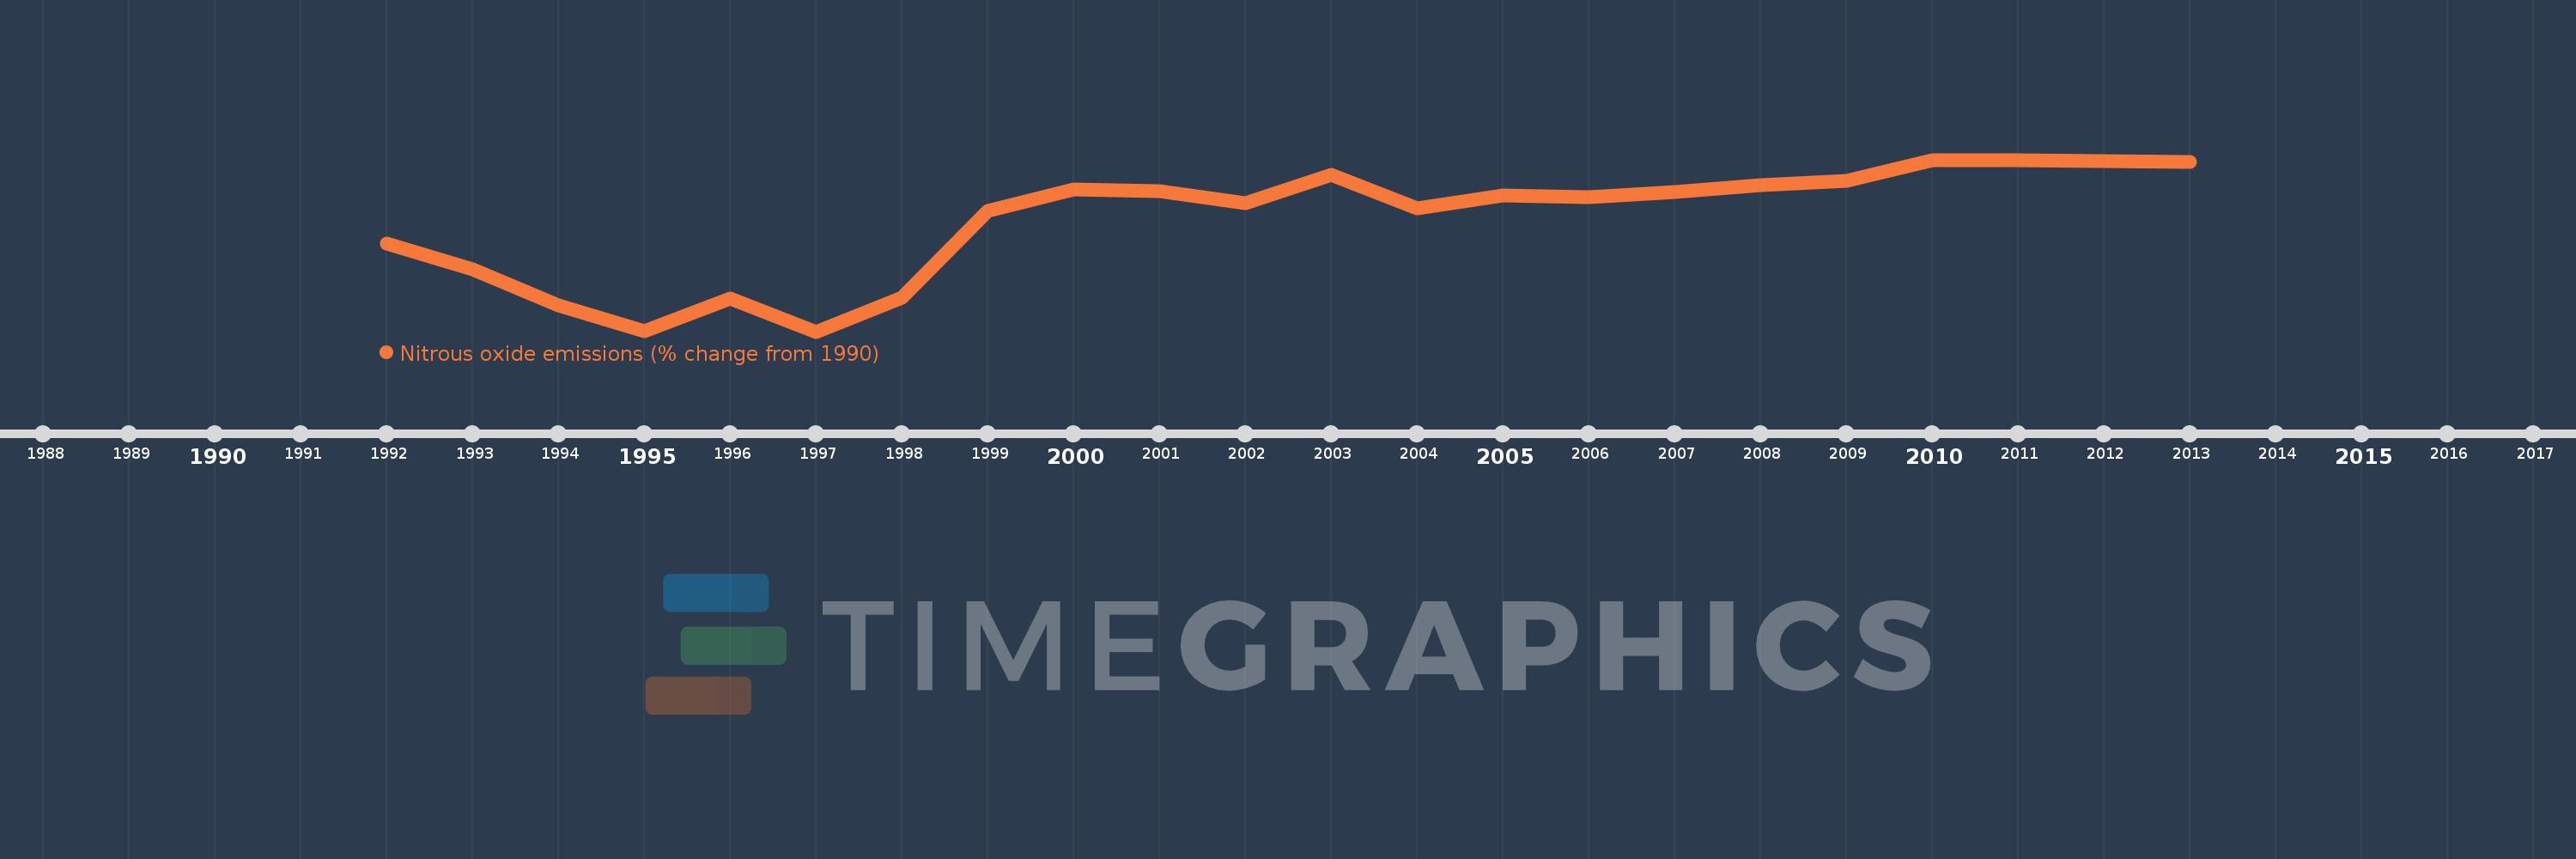
This timeline shows a graph from 1992 to 2013 of Slovenia. No data until 1991. Number of actual observations by date: 22.
Source name:
World Development Indicators
Source organization:
World Bank staff estimates from original source: European Commission, Joint Research Centre (JRC)/Netherlands Environmental Assessment Agency (PBL). Emission Database for Global Atmospheric Research (EDGAR): http://edgar.jrc.ec.europa.eu/.
Categories, topics:
Climate Change, Environment
Last updated:
apr 23, 2017
Indicators value changes by year
Meaning:
-14.5
Minimum:
-26.622
jan 1, 1997
Maximum:
-7.89
jan 1, 2011
At the date of observation
Value
Absolute change
Change from the previous value
jan 1, 1992
-17.035
-17.035
0.0%
jan 1, 1993
-19.799
-2.764
16.23%
jan 1, 1994
-23.751
-3.952
19.96%
jan 1, 1995
-26.571
-2.82
11.87%
jan 1, 1996
-23.003
+3.568
-13.43%
jan 1, 1997
-26.622
-3.619
15.73%
jan 1, 1998
-22.955
+3.666
-13.77%
jan 1, 1999
-13.486
+9.469
-41.25%
jan 1, 2000
-11.155
+2.331
-17.29%
jan 1, 2001
-11.344
-0.189
1.69%
jan 1, 2002
-12.615
-1.272
11.21%
jan 1, 2003
-9.562
+3.053
-24.2%
jan 1, 2004
-13.213
-3.651
38.18%
jan 1, 2005
-11.772
+1.441
-10.9%
jan 1, 2006
-11.99
-0.218
1.85%
jan 1, 2007
-11.386
+0.604
-5.04%
jan 1, 2008
-10.637
+0.749
-6.58%
jan 1, 2009
-10.2
+0.437
-4.11%
jan 1, 2010
-7.925
+2.276
-22.31%
jan 1, 2011
-7.89
+0.035
-0.44%
jan 1, 2012
-8.007
-0.117
1.48%
jan 1, 2013
-8.089
-0.082
1.03%
Ranking of countries by current statistics by years