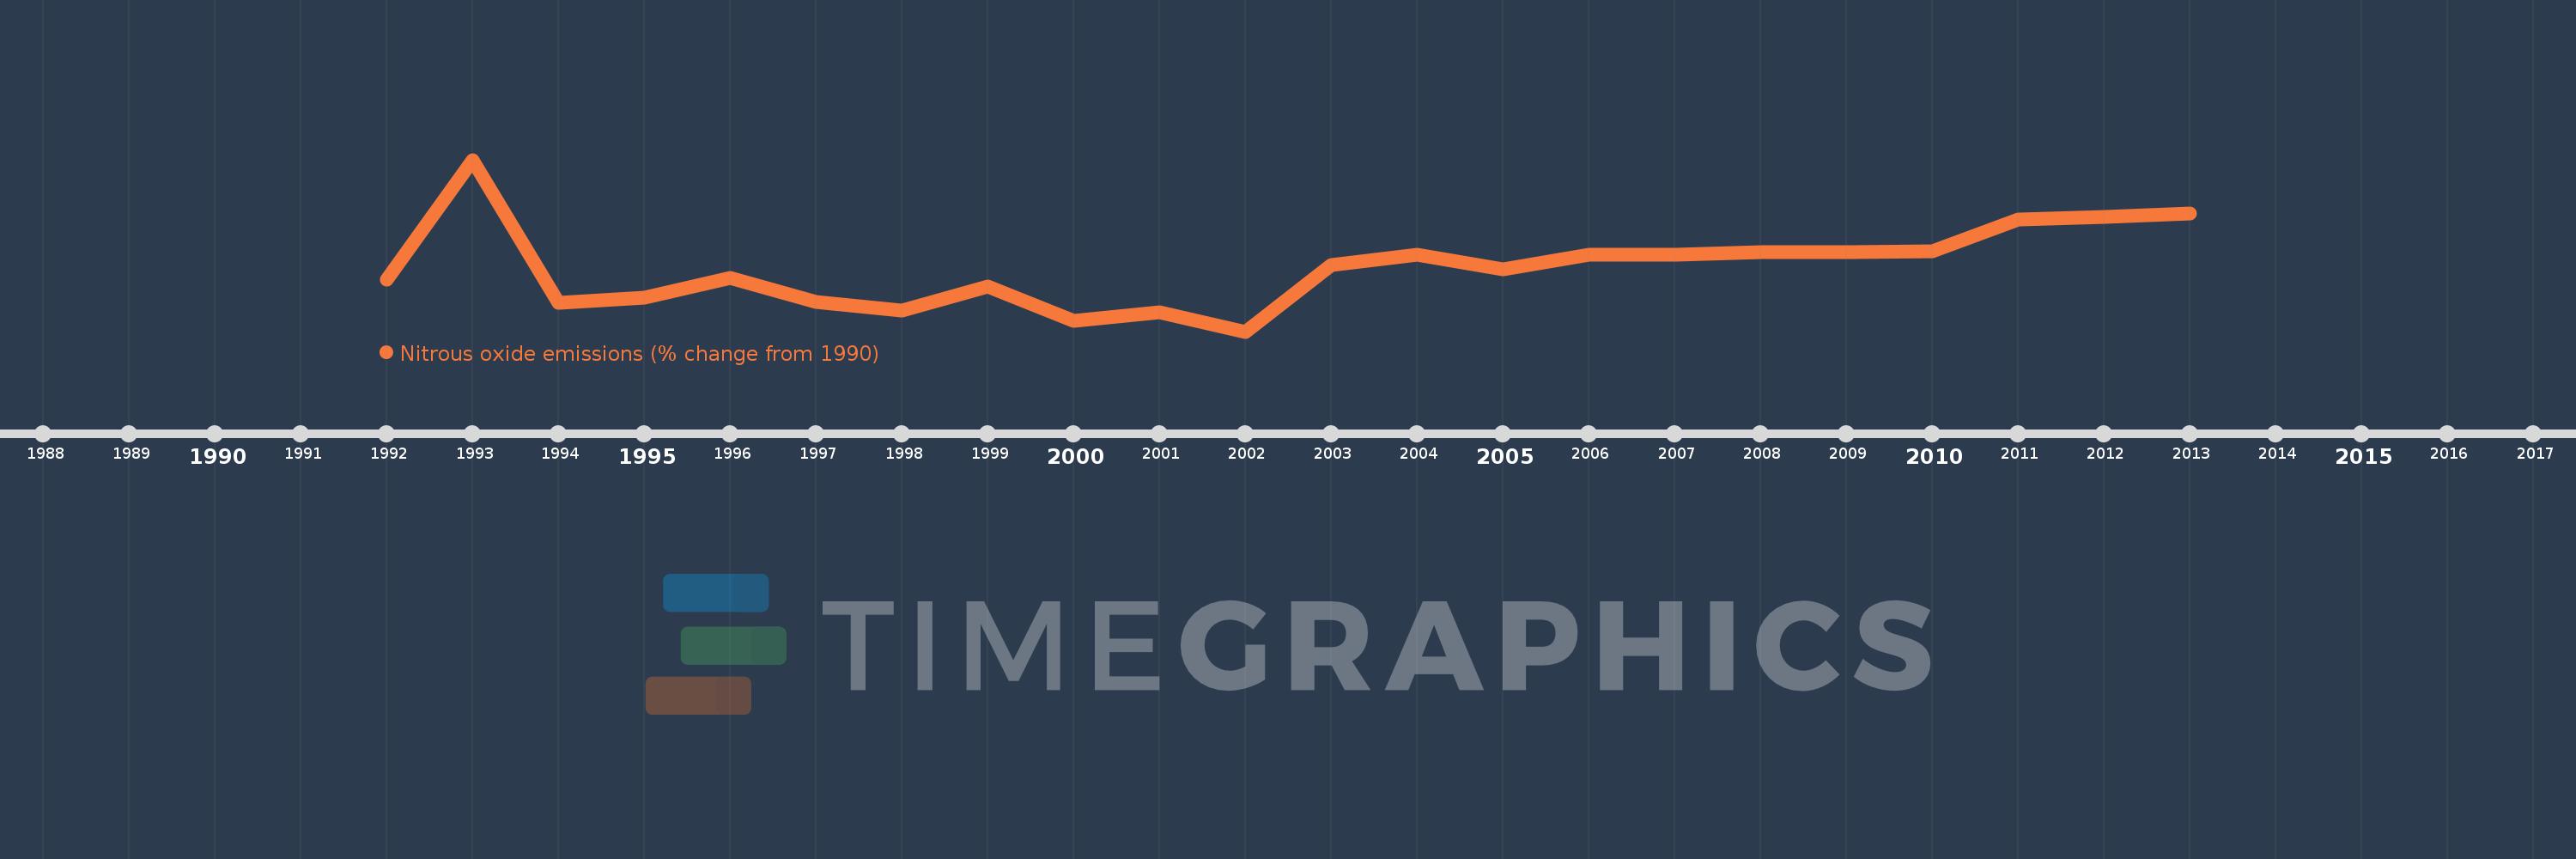
This timeline shows a graph from 1992 to 2013 of Malawi. No data until 1991. Number of actual observations by date: 22.
Source name:
World Development Indicators
Source organization:
World Bank staff estimates from original source: European Commission, Joint Research Centre (JRC)/Netherlands Environmental Assessment Agency (PBL). Emission Database for Global Atmospheric Research (EDGAR): http://edgar.jrc.ec.europa.eu/.
Categories, topics:
Climate Change, Environment
Last updated:
apr 23, 2017
Indicators value changes by year
Meaning:
-8.713
Minimum:
-33.414
jan 1, 2002
Maximum:
32.86
jan 1, 1993
At the date of observation
Value
Absolute change
Change from the previous value
jan 1, 1992
-13.377
-13.377
0.0%
jan 1, 1993
32.86
+46.237
-345.64%
jan 1, 1994
-22.478
-55.338
-168.41%
jan 1, 1995
-20.403
+2.074
-9.23%
jan 1, 1996
-12.763
+7.64
-37.44%
jan 1, 1997
-21.894
-9.131
71.54%
jan 1, 1998
-25.427
-3.533
16.14%
jan 1, 1999
-16.119
+9.308
-36.61%
jan 1, 2000
-29.178
-13.059
81.02%
jan 1, 2001
-25.852
+3.326
-11.4%
jan 1, 2002
-33.414
-7.562
29.25%
jan 1, 2003
-7.668
+25.747
-77.05%
jan 1, 2004
-3.884
+3.783
-49.34%
jan 1, 2005
-9.494
-5.61
144.42%
jan 1, 2006
-3.735
+5.759
-60.66%
jan 1, 2007
-3.605
+0.131
-3.5%
jan 1, 2008
-2.888
+0.716
-19.87%
jan 1, 2009
-2.601
+0.288
-9.96%
jan 1, 2010
-2.533
+0.068
-2.6%
jan 1, 2011
9.825
+12.358
-487.85%
jan 1, 2012
10.923
+1.098
11.18%
jan 1, 2013
12.021
+1.098
10.05%
Ranking of countries by current statistics by years