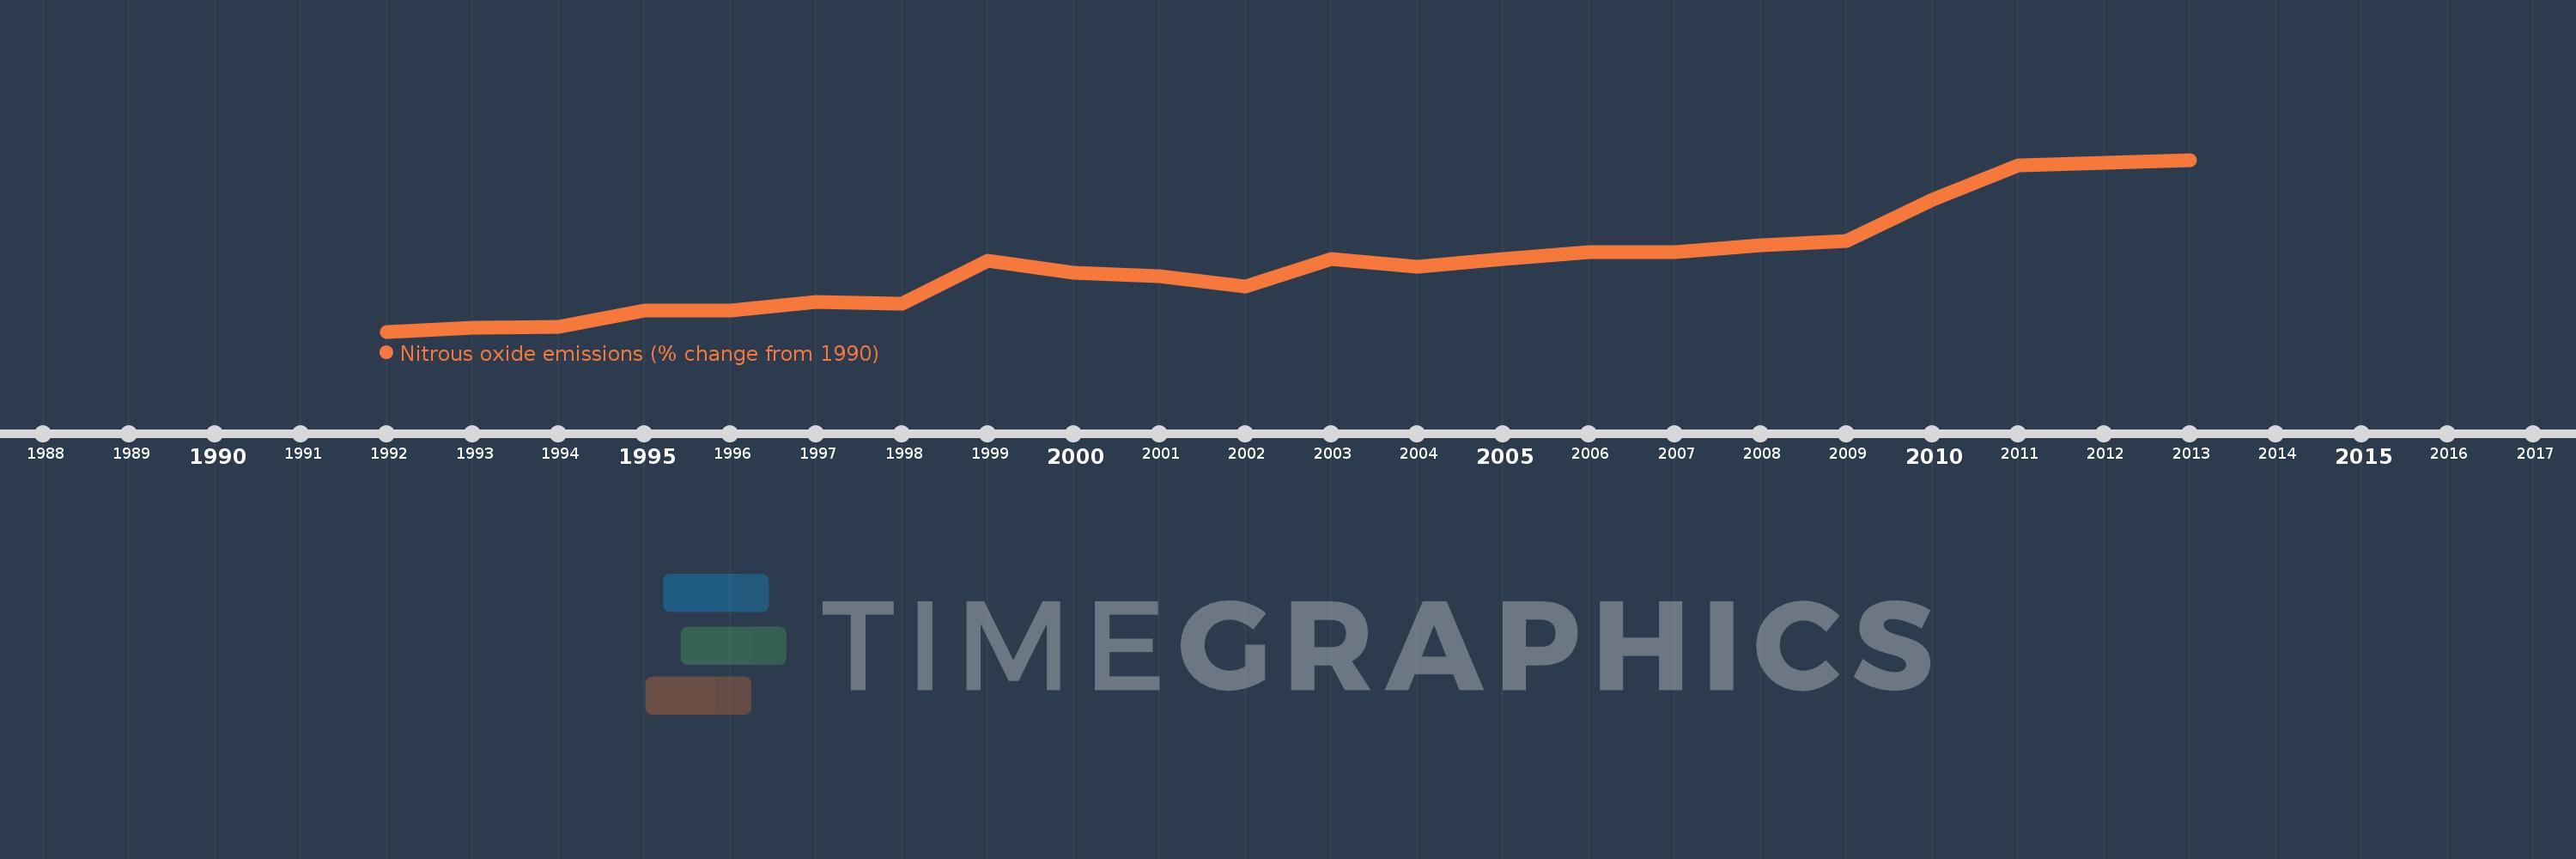
This timeline shows a graph from 1992 to 2013 of Vietnam. No data until 1991. Number of actual observations by date: 22.
Source name:
World Development Indicators
Source organization:
World Bank staff estimates from original source: European Commission, Joint Research Centre (JRC)/Netherlands Environmental Assessment Agency (PBL). Emission Database for Global Atmospheric Research (EDGAR): http://edgar.jrc.ec.europa.eu/.
Categories, topics:
Climate Change, Environment
Last updated:
apr 23, 2017
Indicators value changes by year
Meaning:
85.238
Minimum:
9.658
jan 1, 1992
Maximum:
197.005
jan 1, 2013
At the date of observation
Value
Absolute change
Change from the previous value
jan 1, 1992
9.658
+9.658
0.0%
jan 1, 1993
14.077
+4.419
45.76%
jan 1, 1994
14.772
+0.695
4.94%
jan 1, 1995
32.392
+17.62
119.28%
jan 1, 1996
32.806
+0.414
1.28%
jan 1, 1997
42.191
+9.385
28.61%
jan 1, 1998
40.215
-1.976
-4.68%
jan 1, 1999
87.377
+47.162
117.27%
jan 1, 2000
73.433
-13.944
-15.96%
jan 1, 2001
70.019
-3.413
-4.65%
jan 1, 2002
58.759
-11.26
-16.08%
jan 1, 2003
88.949
+30.19
51.38%
jan 1, 2004
80.064
-8.884
-9.99%
jan 1, 2005
89.083
+9.019
11.26%
jan 1, 2006
96.368
+7.284
8.18%
jan 1, 2007
96.348
-0.02
-0.02%
jan 1, 2008
104.196
+7.848
8.15%
jan 1, 2009
108.432
+4.236
4.07%
jan 1, 2010
153.823
+45.39
41.86%
jan 1, 2011
191.182
+37.359
24.29%
jan 1, 2012
194.093
+2.912
1.52%
jan 1, 2013
197.005
+2.912
1.5%
Ranking of countries by current statistics by years