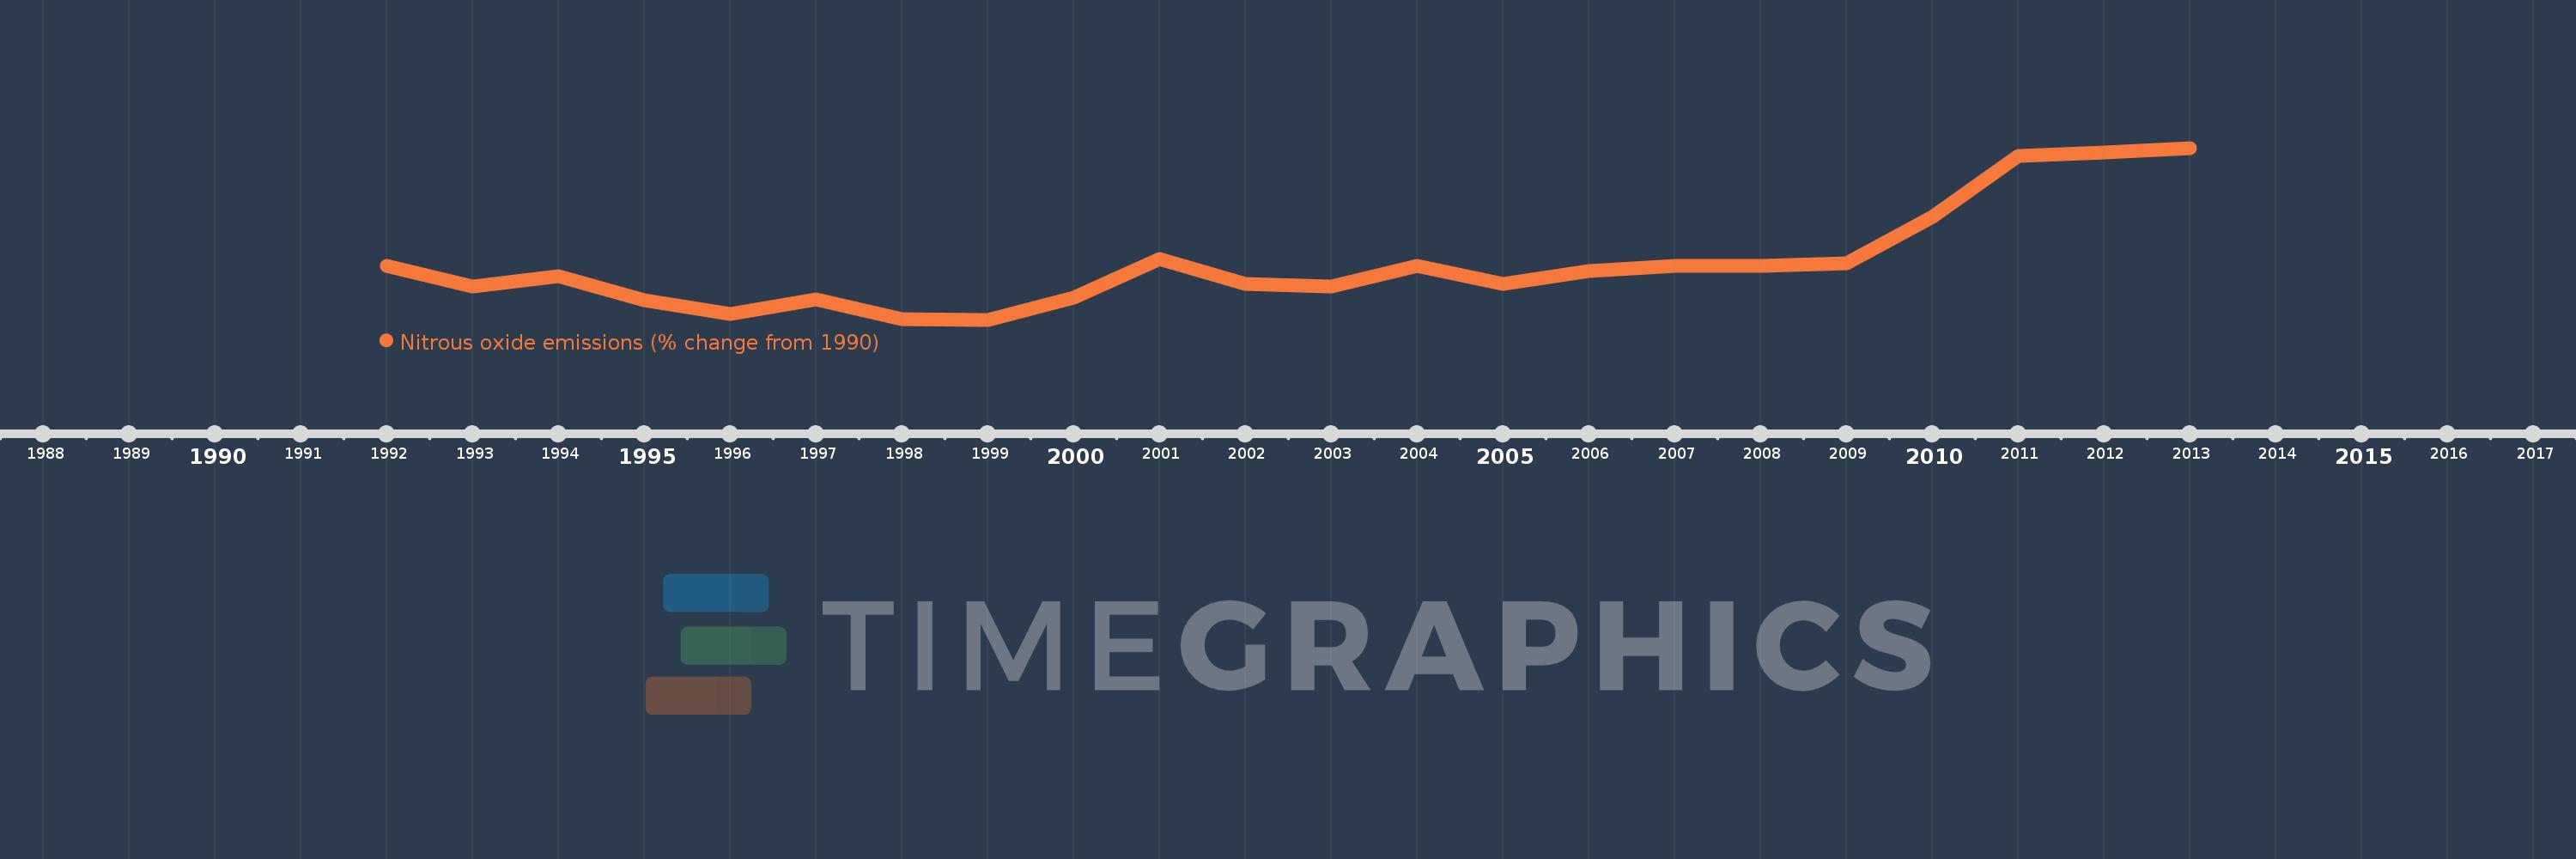
This timeline shows a graph from 1992 to 2013 of Belize. No data until 1991. Number of actual observations by date: 22.
Source name:
World Development Indicators
Source organization:
World Bank staff estimates from original source: European Commission, Joint Research Centre (JRC)/Netherlands Environmental Assessment Agency (PBL). Emission Database for Global Atmospheric Research (EDGAR): http://edgar.jrc.ec.europa.eu/.
Categories, topics:
Climate Change, Environment
Last updated:
apr 23, 2017
Indicators value changes by year
Meaning:
11.939
Minimum:
-8.683
jan 1, 1999
Maximum:
54.347
jan 1, 2013
At the date of observation
Value
Absolute change
Change from the previous value
jan 1, 1992
10.941
+10.941
0.0%
jan 1, 1993
3.369
-7.572
-69.21%
jan 1, 1994
7.278
+3.909
116.04%
jan 1, 1995
-1.413
-8.691
-119.42%
jan 1, 1996
-6.654
-5.241
370.83%
jan 1, 1997
-1.289
+5.365
-80.63%
jan 1, 1998
-8.404
-7.115
551.97%
jan 1, 1999
-8.683
-0.279
3.32%
jan 1, 2000
-0.487
+8.197
-94.4%
jan 1, 2001
13.496
+13.983
-2.87K%
jan 1, 2002
4.414
-9.082
-67.3%
jan 1, 2003
3.452
-0.962
-21.8%
jan 1, 2004
10.957
+7.506
217.44%
jan 1, 2005
4.567
-6.391
-58.32%
jan 1, 2006
9.239
+4.673
102.32%
jan 1, 2007
10.997
+1.758
19.03%
jan 1, 2008
11.157
+0.16
1.45%
jan 1, 2009
12.163
+1.006
9.02%
jan 1, 2010
29.063
+16.9
138.94%
jan 1, 2011
51.32
+22.257
76.58%
jan 1, 2012
52.833
+1.513
2.95%
jan 1, 2013
54.347
+1.513
2.86%
Ranking of countries by current statistics by years