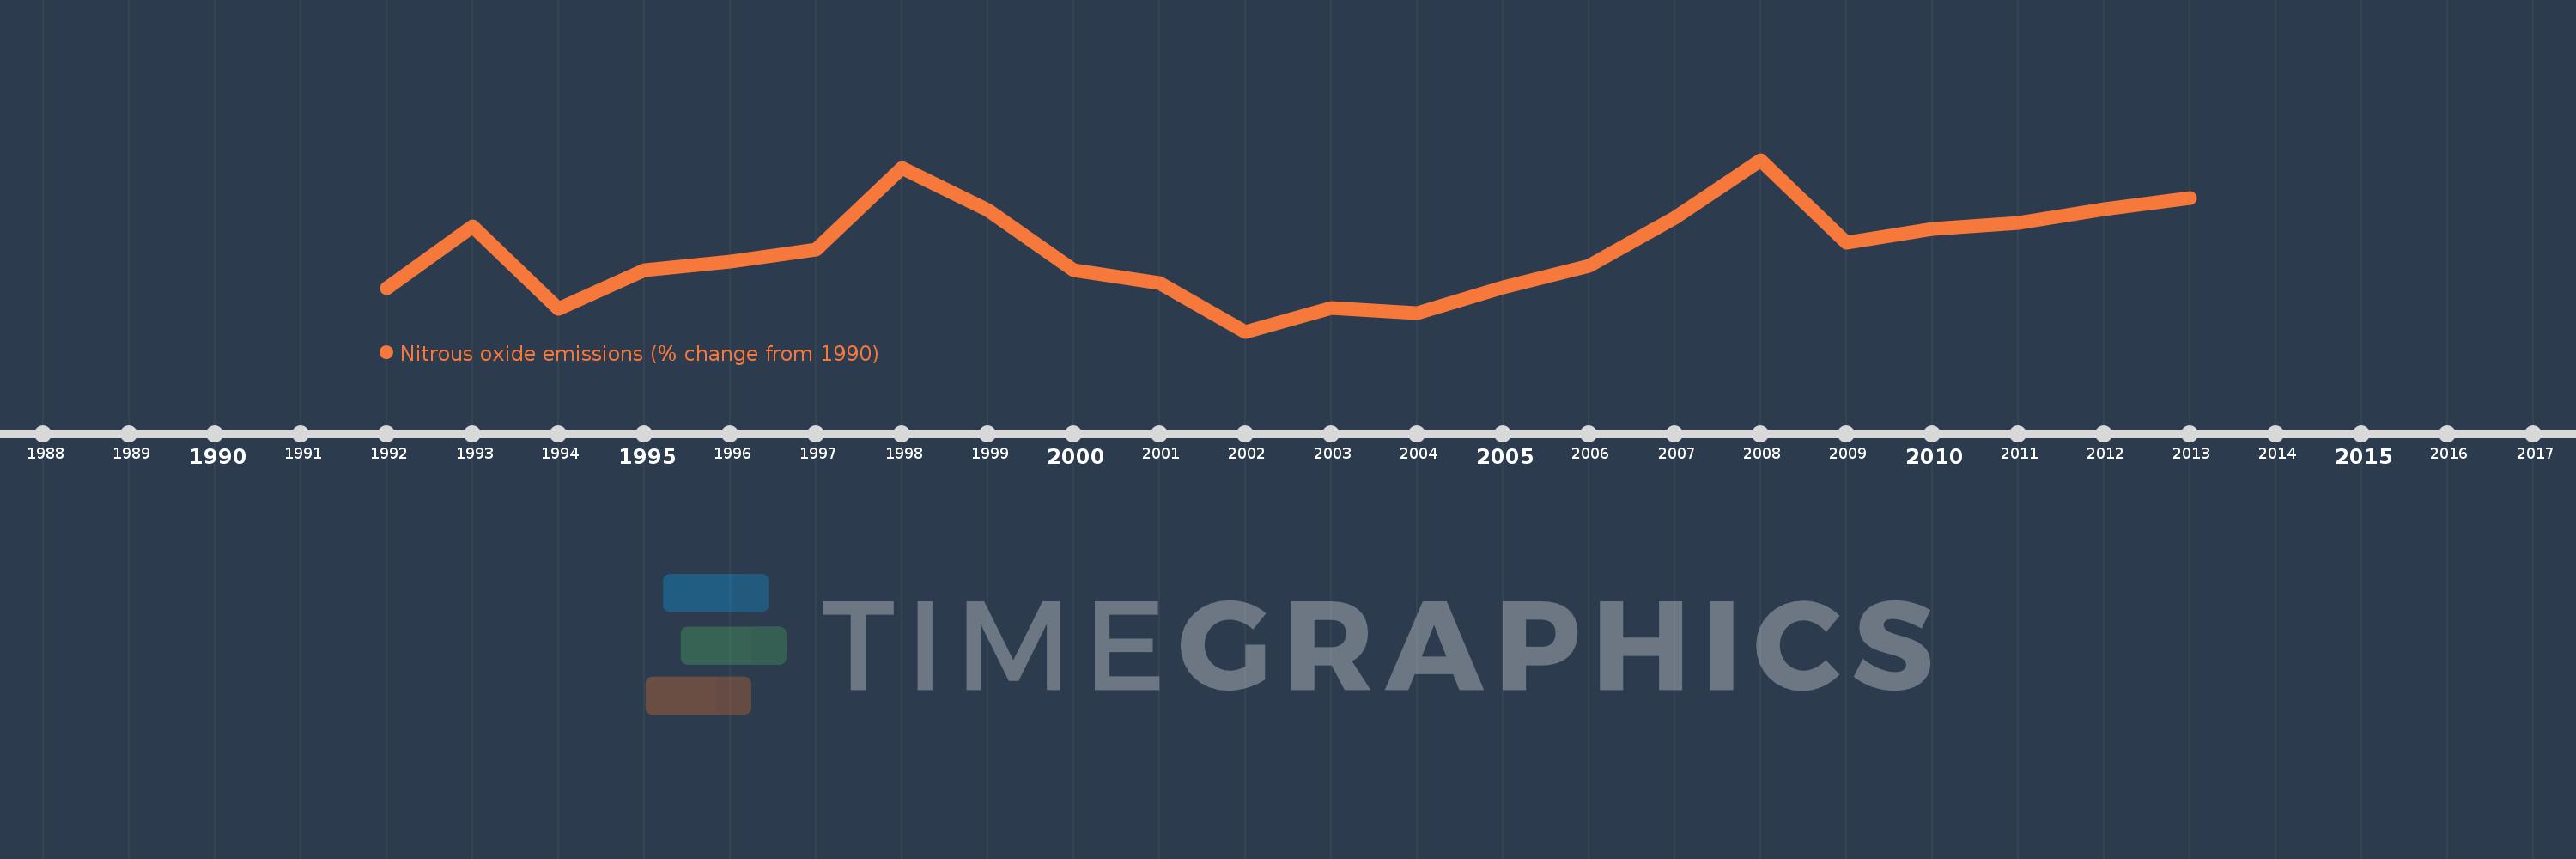
This timeline shows a graph from 1992 to 2013 of World. No data until 1991. Number of actual observations by date: 22.
Source name:
World Development Indicators
Source organization:
World Bank staff estimates from original source: European Commission, Joint Research Centre (JRC)/Netherlands Environmental Assessment Agency (PBL). Emission Database for Global Atmospheric Research (EDGAR): http://edgar.jrc.ec.europa.eu/.
Categories, topics:
Climate Change, Environment
Last updated:
apr 23, 2017
Indicators value changes by year
Meaning:
1.866
Minimum:
-5.675
jan 1, 2002
Maximum:
10.398
jan 1, 2008
At the date of observation
Value
Absolute change
Change from the previous value
jan 1, 1992
-1.641
-1.641
0.0%
jan 1, 1993
4.167
+5.808
-353.98%
jan 1, 1994
-3.523
-7.69
-184.55%
jan 1, 1995
0.08
+3.603
-102.27%
jan 1, 1996
0.871
+0.791
988.45%
jan 1, 1997
1.997
+1.126
129.36%
jan 1, 1998
9.609
+7.612
381.19%
jan 1, 1999
5.688
-3.921
-40.8%
jan 1, 2000
0.087
-5.602
-98.48%
jan 1, 2001
-1.1
-1.187
-1.37K%
jan 1, 2002
-5.675
-4.574
415.64%
jan 1, 2003
-3.477
+2.198
-38.73%
jan 1, 2004
-3.94
-0.463
13.32%
jan 1, 2005
-1.543
+2.397
-60.85%
jan 1, 2006
0.434
+1.976
-128.11%
jan 1, 2007
4.984
+4.55
1.05K%
jan 1, 2008
10.398
+5.414
108.62%
jan 1, 2009
2.675
-7.723
-74.28%
jan 1, 2010
3.917
+1.242
46.45%
jan 1, 2011
4.466
+0.549
14.02%
jan 1, 2012
5.775
+1.309
29.31%
jan 1, 2013
6.798
+1.022
17.7%
Ranking of countries by current statistics by years