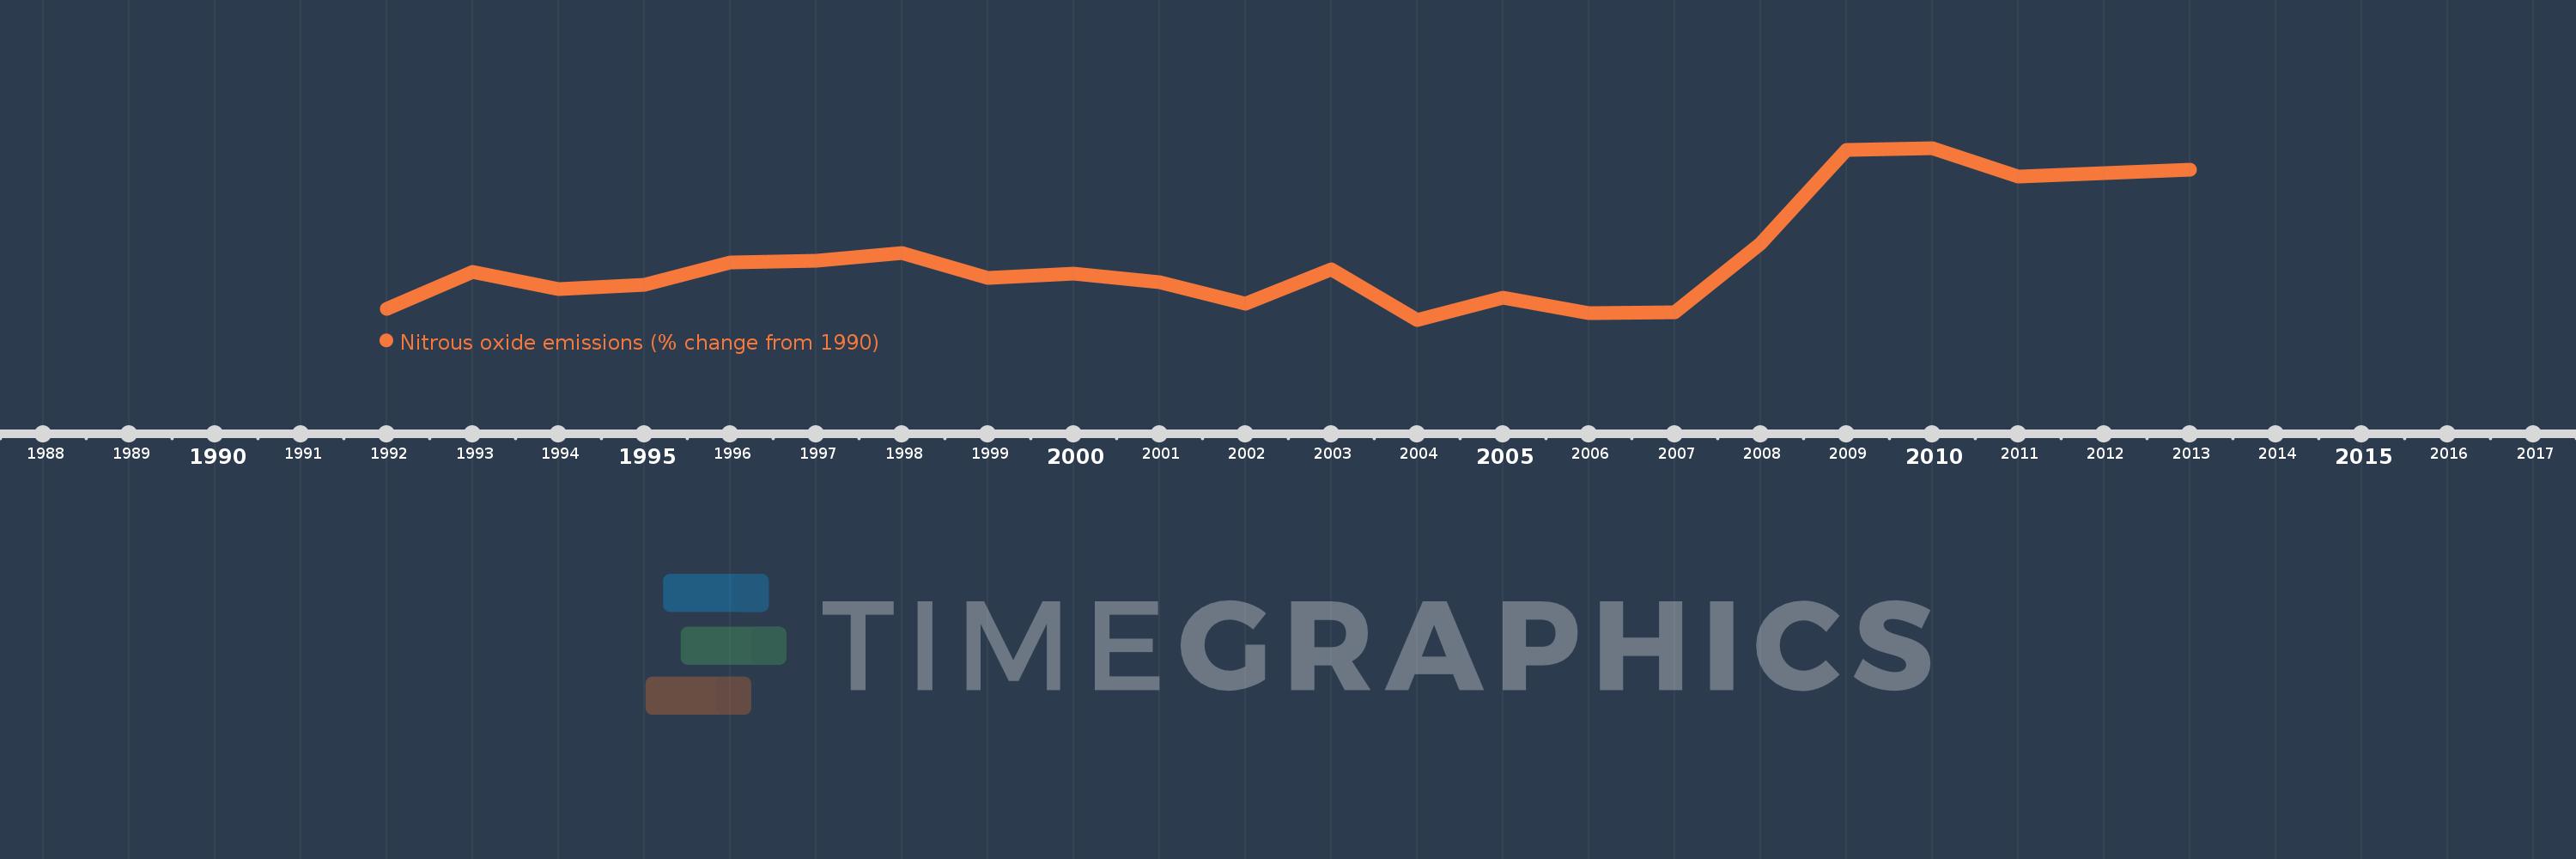
This timeline shows a graph from 1992 to 2013 of Benin. No data until 1991. Number of actual observations by date: 22.
Source name:
World Development Indicators
Source organization:
World Bank staff estimates from original source: European Commission, Joint Research Centre (JRC)/Netherlands Environmental Assessment Agency (PBL). Emission Database for Global Atmospheric Research (EDGAR): http://edgar.jrc.ec.europa.eu/.
Categories, topics:
Climate Change, Environment
Last updated:
apr 23, 2017
Indicators value changes by year
Meaning:
-1.104
Minimum:
-24.171
jan 1, 2004
Maximum:
38.289
jan 1, 2010
At the date of observation
Value
Absolute change
Change from the previous value
jan 1, 1992
-20.105
-20.105
0.0%
jan 1, 1993
-6.842
+13.263
-65.97%
jan 1, 1994
-12.882
-6.04
88.29%
jan 1, 1995
-11.395
+1.487
-11.55%
jan 1, 1996
-3.265
+8.13
-71.35%
jan 1, 1997
-2.703
+0.562
-17.22%
jan 1, 1998
0.247
+2.949
-109.13%
jan 1, 1999
-8.955
-9.202
-3.73K%
jan 1, 2000
-7.307
+1.648
-18.4%
jan 1, 2001
-10.42
-3.113
42.6%
jan 1, 2002
-18.342
-7.922
76.02%
jan 1, 2003
-5.872
+12.47
-67.99%
jan 1, 2004
-24.171
-18.299
311.64%
jan 1, 2005
-16.016
+8.155
-33.74%
jan 1, 2006
-21.759
-5.743
35.86%
jan 1, 2007
-21.368
+0.391
-1.8%
jan 1, 2008
3.659
+25.027
-117.13%
jan 1, 2009
37.599
+33.94
927.49%
jan 1, 2010
38.289
+0.689
1.83%
jan 1, 2011
27.827
-10.461
-27.32%
jan 1, 2012
29.105
+1.278
4.59%
jan 1, 2013
30.384
+1.278
4.39%
Ranking of countries by current statistics by years