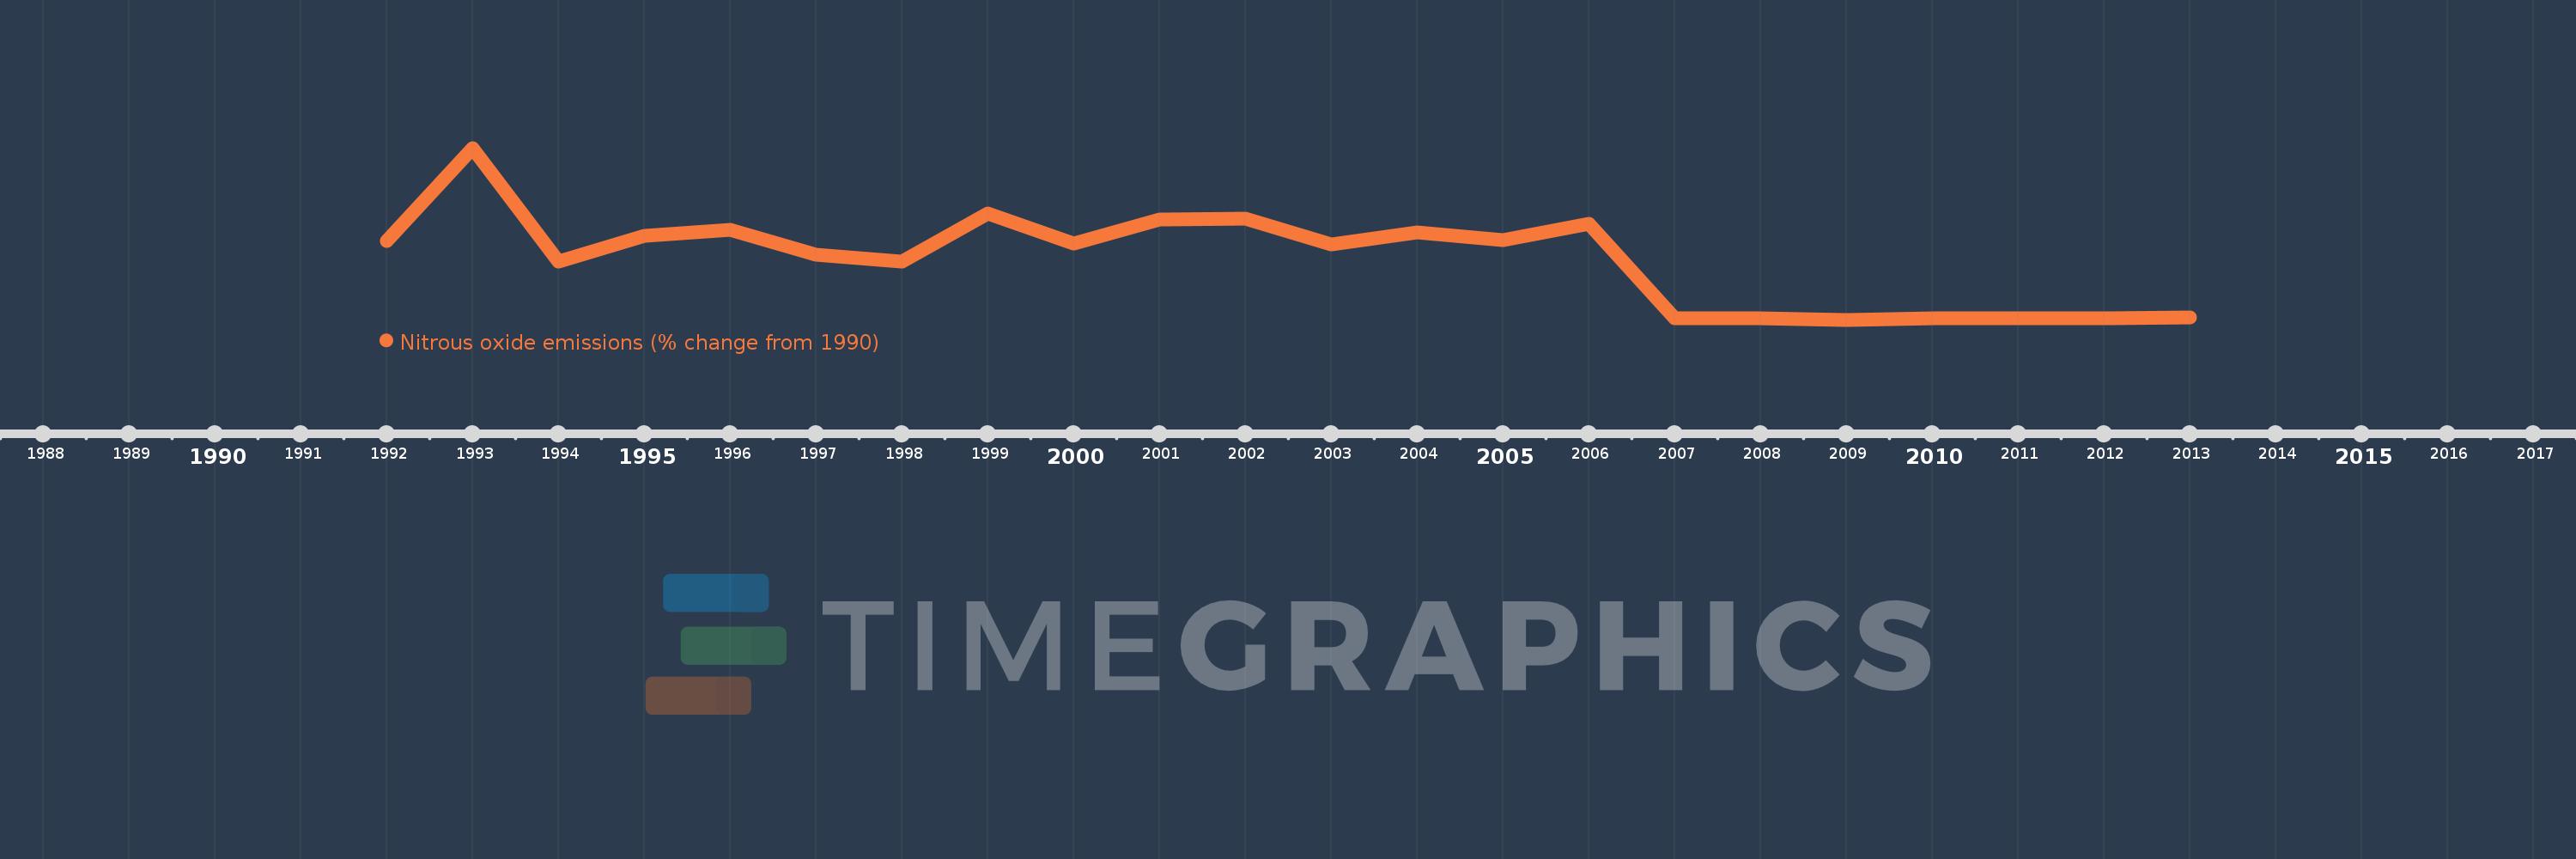
This timeline shows a graph from 1992 to 2013 of Mozambique. No data until 1991. Number of actual observations by date: 22.
Source name:
World Development Indicators
Source organization:
World Bank staff estimates from original source: European Commission, Joint Research Centre (JRC)/Netherlands Environmental Assessment Agency (PBL). Emission Database for Global Atmospheric Research (EDGAR): http://edgar.jrc.ec.europa.eu/.
Categories, topics:
Climate Change, Environment
Last updated:
apr 23, 2017
Indicators value changes by year
Meaning:
-37.185
Minimum:
-80.042
jan 1, 2009
Maximum:
41.208
jan 1, 1993
At the date of observation
Value
Absolute change
Change from the previous value
jan 1, 1992
-24.2
-24.2
0.0%
jan 1, 1993
41.208
+65.408
-270.28%
jan 1, 1994
-38.768
-79.975
-194.08%
jan 1, 1995
-20.599
+18.168
-46.86%
jan 1, 1996
-16.843
+3.756
-18.24%
jan 1, 1997
-34.312
-17.469
103.72%
jan 1, 1998
-39.134
-4.822
14.05%
jan 1, 1999
-5.068
+34.066
-87.05%
jan 1, 2000
-26.276
-21.207
418.43%
jan 1, 2001
-9.518
+16.757
-63.77%
jan 1, 2002
-8.93
+0.589
-6.19%
jan 1, 2003
-26.721
-17.791
199.24%
jan 1, 2004
-18.115
+8.606
-32.21%
jan 1, 2005
-23.986
-5.871
32.41%
jan 1, 2006
-12.215
+11.771
-49.07%
jan 1, 2007
-79.23
-67.015
548.63%
jan 1, 2008
-79.277
-0.047
0.06%
jan 1, 2009
-80.042
-0.765
0.96%
jan 1, 2010
-79.308
+0.734
-0.92%
jan 1, 2011
-79.123
+0.185
-0.23%
jan 1, 2012
-78.914
+0.209
-0.26%
jan 1, 2013
-78.705
+0.209
-0.26%
Ranking of countries by current statistics by years