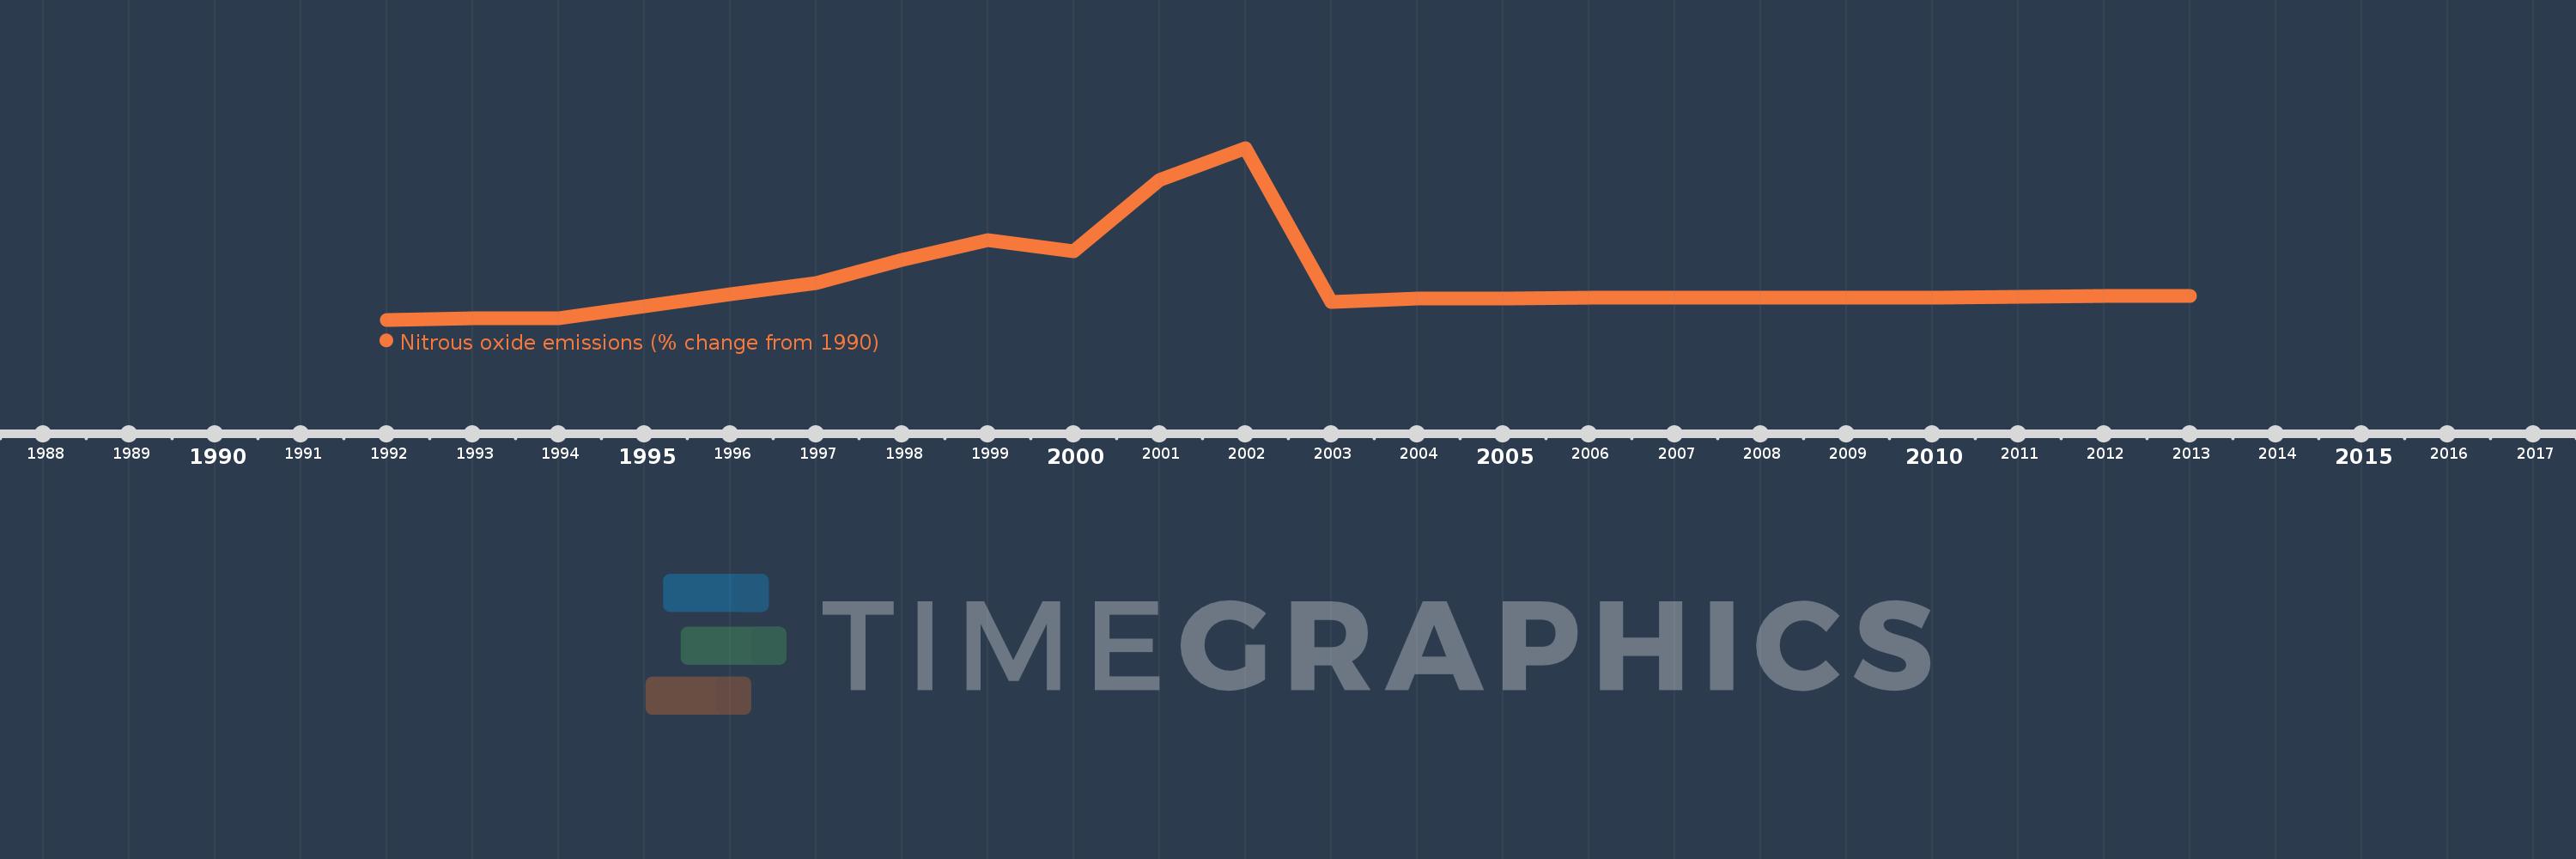
This timeline shows a graph from 1992 to 2013 of Singapore. No data until 1991. Number of actual observations by date: 22.
Source name:
World Development Indicators
Source organization:
World Bank staff estimates from original source: European Commission, Joint Research Centre (JRC)/Netherlands Environmental Assessment Agency (PBL). Emission Database for Global Atmospheric Research (EDGAR): http://edgar.jrc.ec.europa.eu/.
Categories, topics:
Climate Change, Environment
Last updated:
apr 23, 2017
Indicators value changes by year
Meaning:
174.941
Minimum:
1.92
jan 1, 1992
Maximum:
780.135
jan 1, 2002
At the date of observation
Value
Absolute change
Change from the previous value
jan 1, 1992
1.92
+1.92
0.0%
jan 1, 1993
7.025
+5.105
265.95%
jan 1, 1994
9.637
+2.611
37.17%
jan 1, 1995
62.967
+53.331
553.42%
jan 1, 1996
116.869
+53.902
85.6%
jan 1, 1997
169.002
+52.133
44.61%
jan 1, 1998
272.081
+103.079
60.99%
jan 1, 1999
363.872
+91.792
33.74%
jan 1, 2000
312.814
-51.058
-14.03%
jan 1, 2001
634.372
+321.558
102.8%
jan 1, 2002
780.135
+145.763
22.98%
jan 1, 2003
81.593
-698.542
-89.54%
jan 1, 2004
99.537
+17.945
21.99%
jan 1, 2005
97.594
-1.943
-1.95%
jan 1, 2006
100.604
+3.01
3.08%
jan 1, 2007
101.17
+0.566
0.56%
jan 1, 2008
103.549
+2.379
2.35%
jan 1, 2009
103.26
-0.289
-0.28%
jan 1, 2010
103.19
-0.071
-0.07%
jan 1, 2011
107.098
+3.908
3.79%
jan 1, 2012
109.169
+2.071
1.93%
jan 1, 2013
111.24
+2.071
1.9%
Ranking of countries by current statistics by years