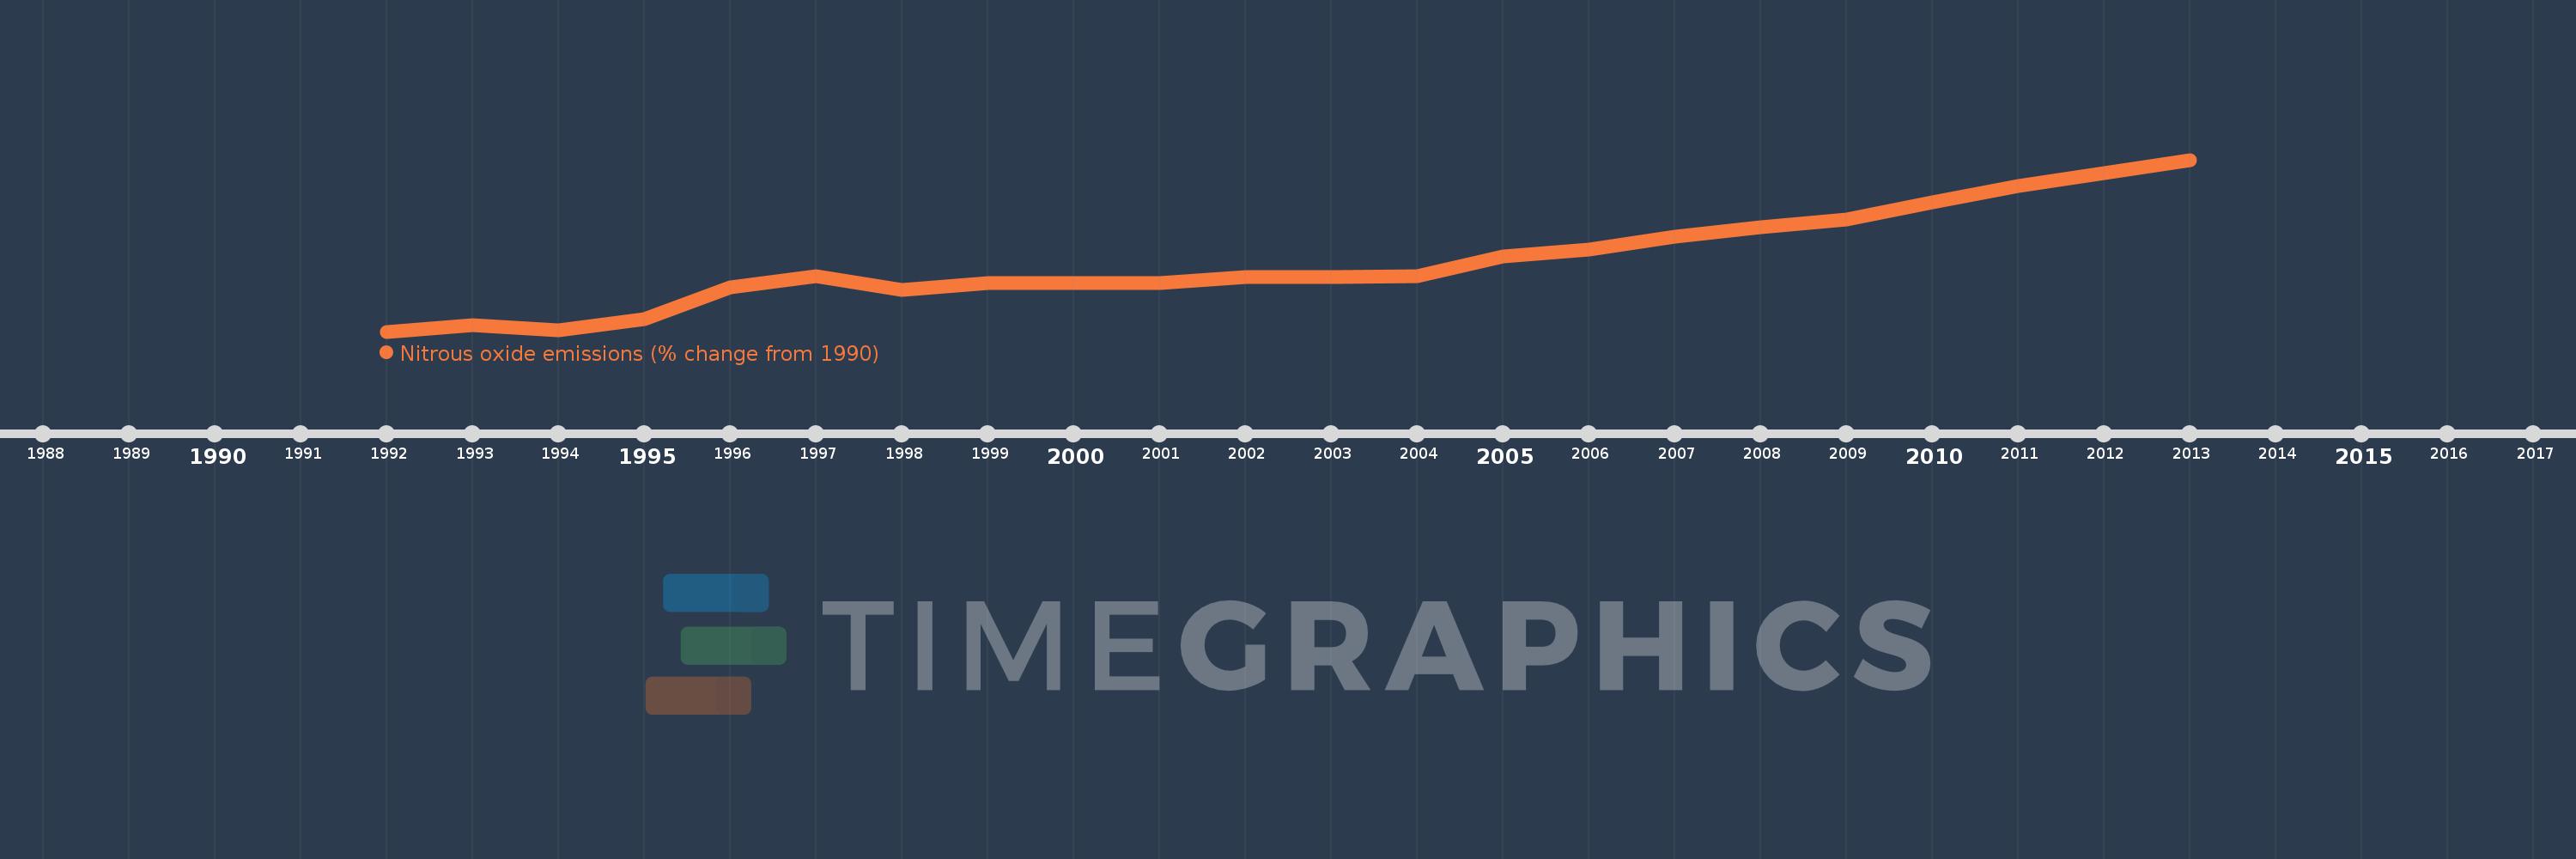
This timeline shows a graph from 1992 to 2013 of China. No data until 1991. Number of actual observations by date: 22.
Source name:
World Development Indicators
Source organization:
World Bank staff estimates from original source: European Commission, Joint Research Centre (JRC)/Netherlands Environmental Assessment Agency (PBL). Emission Database for Global Atmospheric Research (EDGAR): http://edgar.jrc.ec.europa.eu/.
Categories, topics:
Climate Change, Environment
Last updated:
apr 23, 2017
Indicators value changes by year
Meaning:
30.492
Minimum:
1.42
jan 1, 1992
Maximum:
72.467
jan 1, 2013
At the date of observation
Value
Absolute change
Change from the previous value
jan 1, 1992
1.42
+1.42
0.0%
jan 1, 1993
3.954
+2.534
178.51%
jan 1, 1994
1.998
-1.956
-49.47%
jan 1, 1995
6.748
+4.75
237.78%
jan 1, 1996
19.868
+13.12
194.43%
jan 1, 1997
24.405
+4.536
22.83%
jan 1, 1998
18.565
-5.839
-23.93%
jan 1, 1999
21.644
+3.079
16.58%
jan 1, 2000
21.644
0.0
0.0%
jan 1, 2001
21.644
0.0
0.0%
jan 1, 2002
23.934
+2.29
10.58%
jan 1, 2003
23.934
0.0
0.0%
jan 1, 2004
24.428
+0.494
2.07%
jan 1, 2005
32.358
+7.93
32.46%
jan 1, 2006
35.275
+2.917
9.01%
jan 1, 2007
40.66
+5.385
15.27%
jan 1, 2008
44.561
+3.901
9.59%
jan 1, 2009
47.613
+3.052
6.85%
jan 1, 2010
55.014
+7.401
15.54%
jan 1, 2011
61.637
+6.623
12.04%
jan 1, 2012
67.052
+5.415
8.79%
jan 1, 2013
72.467
+5.415
8.08%
Ranking of countries by current statistics by years