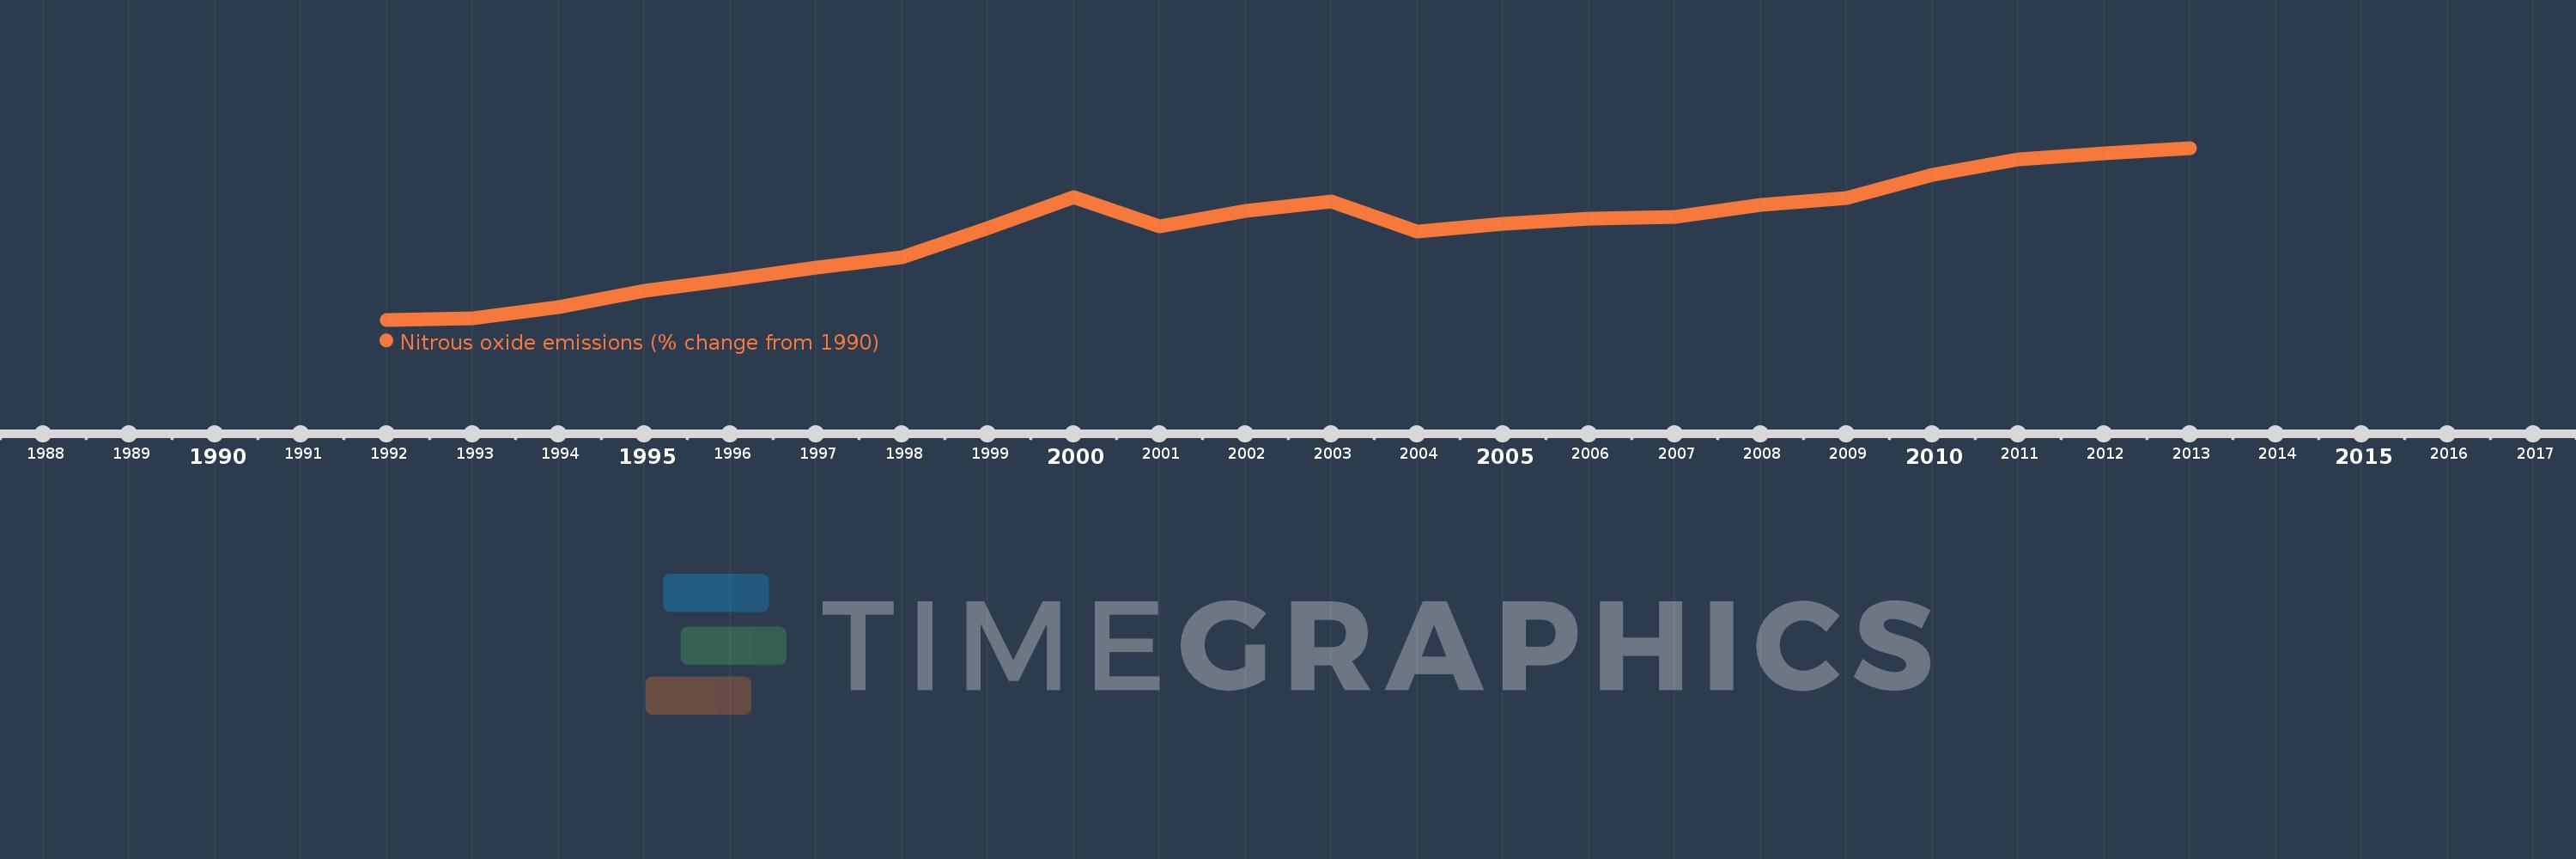
This timeline shows a graph from 1992 to 2013 of Comoros. No data until 1991. Number of actual observations by date: 22.
Source name:
World Development Indicators
Source organization:
World Bank staff estimates from original source: European Commission, Joint Research Centre (JRC)/Netherlands Environmental Assessment Agency (PBL). Emission Database for Global Atmospheric Research (EDGAR): http://edgar.jrc.ec.europa.eu/.
Categories, topics:
Climate Change, Environment
Last updated:
apr 23, 2017
Indicators value changes by year
Meaning:
21.704
Minimum:
-0.533
jan 1, 1992
Maximum:
41.476
jan 1, 2013
At the date of observation
Value
Absolute change
Change from the previous value
jan 1, 1992
-0.533
-0.533
0.0%
jan 1, 1993
-0.1
+0.433
-81.16%
jan 1, 1994
2.518
+2.618
-2.61K%
jan 1, 1995
6.554
+4.036
160.3%
jan 1, 1996
9.323
+2.769
42.25%
jan 1, 1997
12.157
+2.833
30.39%
jan 1, 1998
14.726
+2.57
21.14%
jan 1, 1999
21.941
+7.215
48.99%
jan 1, 2000
29.531
+7.589
34.59%
jan 1, 2001
22.312
-7.219
-24.45%
jan 1, 2002
26.097
+3.785
16.97%
jan 1, 2003
28.353
+2.255
8.64%
jan 1, 2004
20.983
-7.369
-25.99%
jan 1, 2005
22.835
+1.852
8.83%
jan 1, 2006
24.177
+1.341
5.87%
jan 1, 2007
24.546
+0.369
1.53%
jan 1, 2008
27.585
+3.039
12.38%
jan 1, 2009
29.258
+1.673
6.06%
jan 1, 2010
34.962
+5.705
19.5%
jan 1, 2011
38.702
+3.74
10.7%
jan 1, 2012
40.089
+1.387
3.58%
jan 1, 2013
41.476
+1.387
3.46%
Ranking of countries by current statistics by years