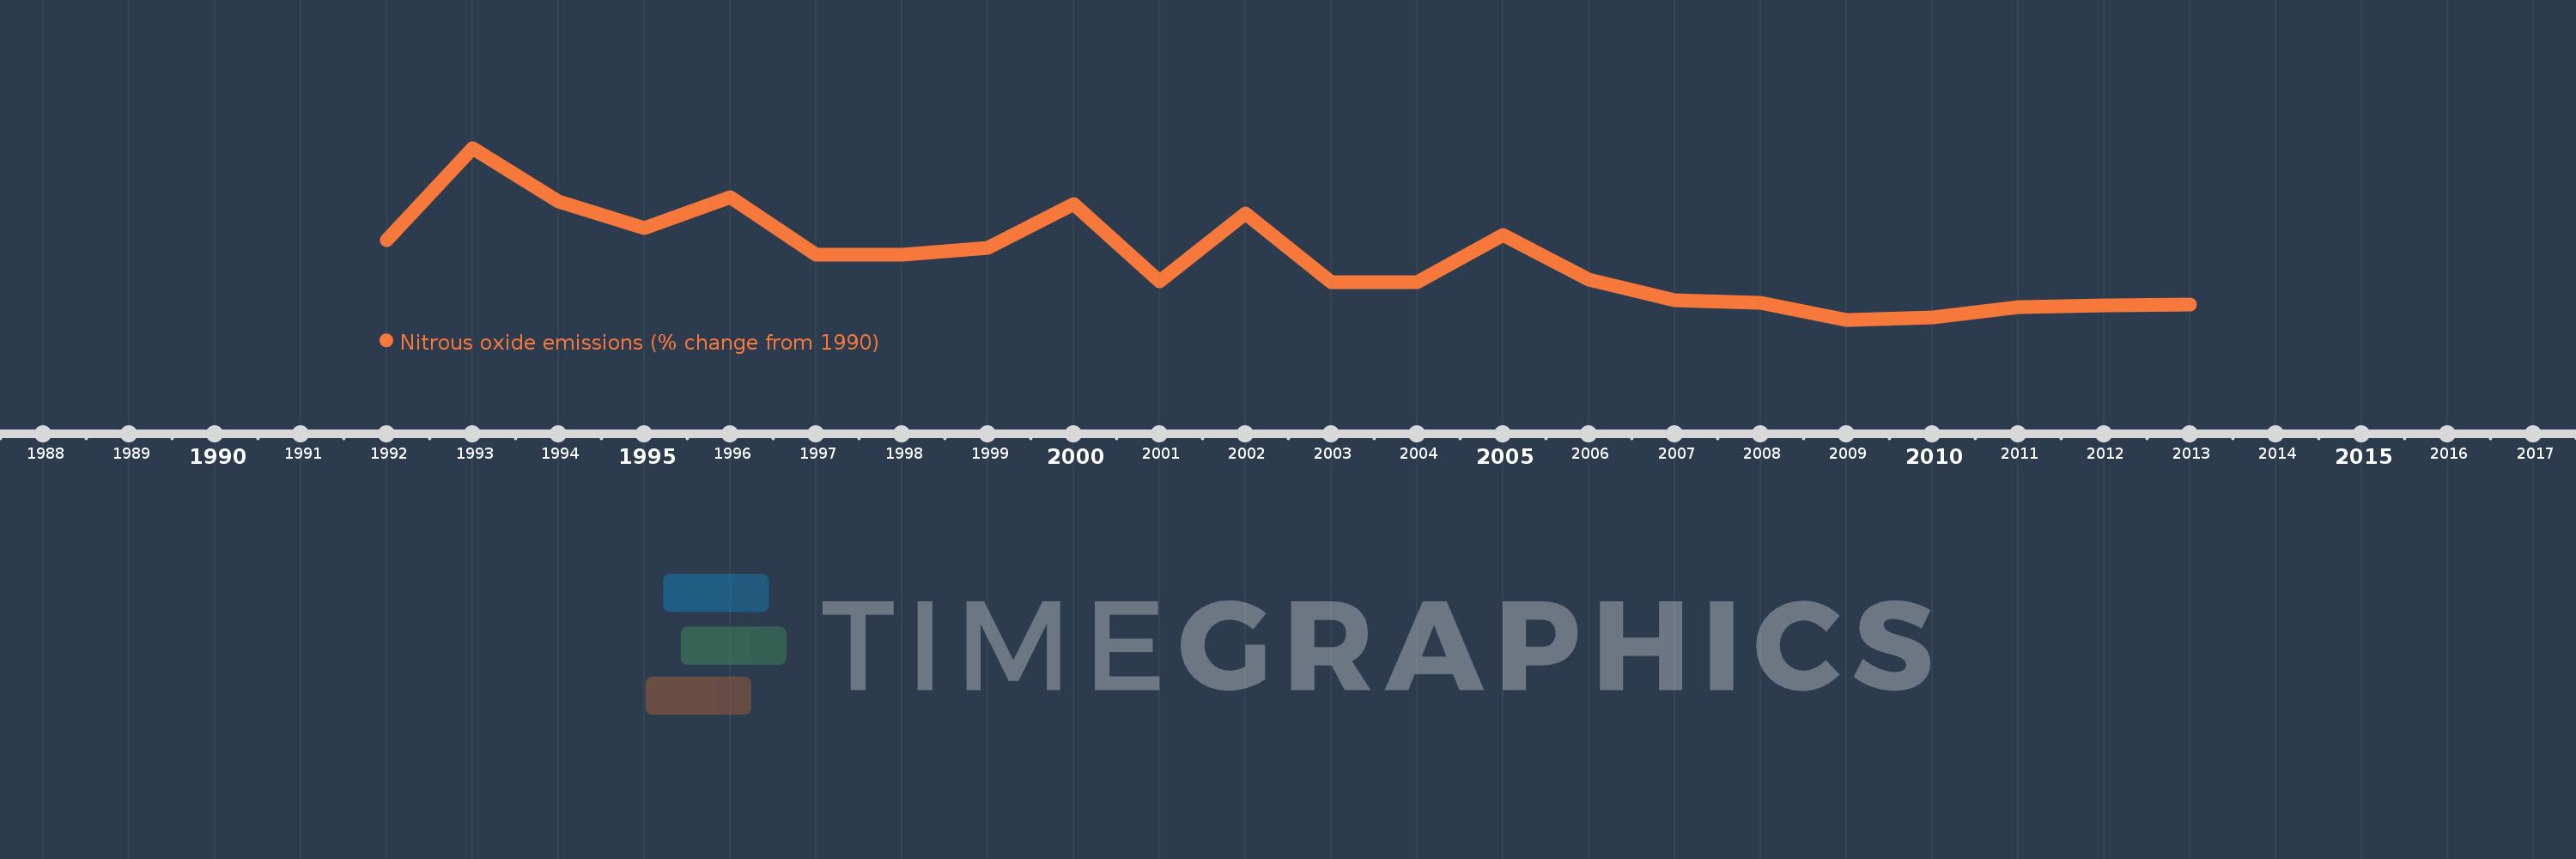
This timeline shows a graph from 1992 to 2013 of Myanmar. No data until 1991. Number of actual observations by date: 22.
Source name:
World Development Indicators
Source organization:
World Bank staff estimates from original source: European Commission, Joint Research Centre (JRC)/Netherlands Environmental Assessment Agency (PBL). Emission Database for Global Atmospheric Research (EDGAR): http://edgar.jrc.ec.europa.eu/.
Categories, topics:
Climate Change, Environment
Last updated:
apr 23, 2017
Indicators value changes by year
Meaning:
-19.564
Minimum:
-46.385
jan 1, 2009
Maximum:
29.959
jan 1, 1993
At the date of observation
Value
Absolute change
Change from the previous value
jan 1, 1992
-11.12
-11.12
0.0%
jan 1, 1993
29.959
+41.078
-369.42%
jan 1, 1994
6.234
-23.725
-79.19%
jan 1, 1995
-5.693
-11.927
-191.33%
jan 1, 1996
8.107
+13.8
-242.4%
jan 1, 1997
-17.319
-25.426
-313.62%
jan 1, 1998
-17.423
-0.104
0.6%
jan 1, 1999
-14.489
+2.934
-16.84%
jan 1, 2000
5.185
+19.675
-135.79%
jan 1, 2001
-29.374
-34.56
-666.49%
jan 1, 2002
0.963
+30.338
-103.28%
jan 1, 2003
-29.546
-30.509
-3.17K%
jan 1, 2004
-29.72
-0.174
0.59%
jan 1, 2005
-8.893
+20.827
-70.08%
jan 1, 2006
-28.539
-19.645
220.9%
jan 1, 2007
-37.787
-9.248
32.41%
jan 1, 2008
-38.912
-1.125
2.98%
jan 1, 2009
-46.385
-7.473
19.21%
jan 1, 2010
-45.177
+1.208
-2.6%
jan 1, 2011
-40.752
+4.425
-9.8%
jan 1, 2012
-40.159
+0.592
-1.45%
jan 1, 2013
-39.567
+0.592
-1.48%
Ranking of countries by current statistics by years