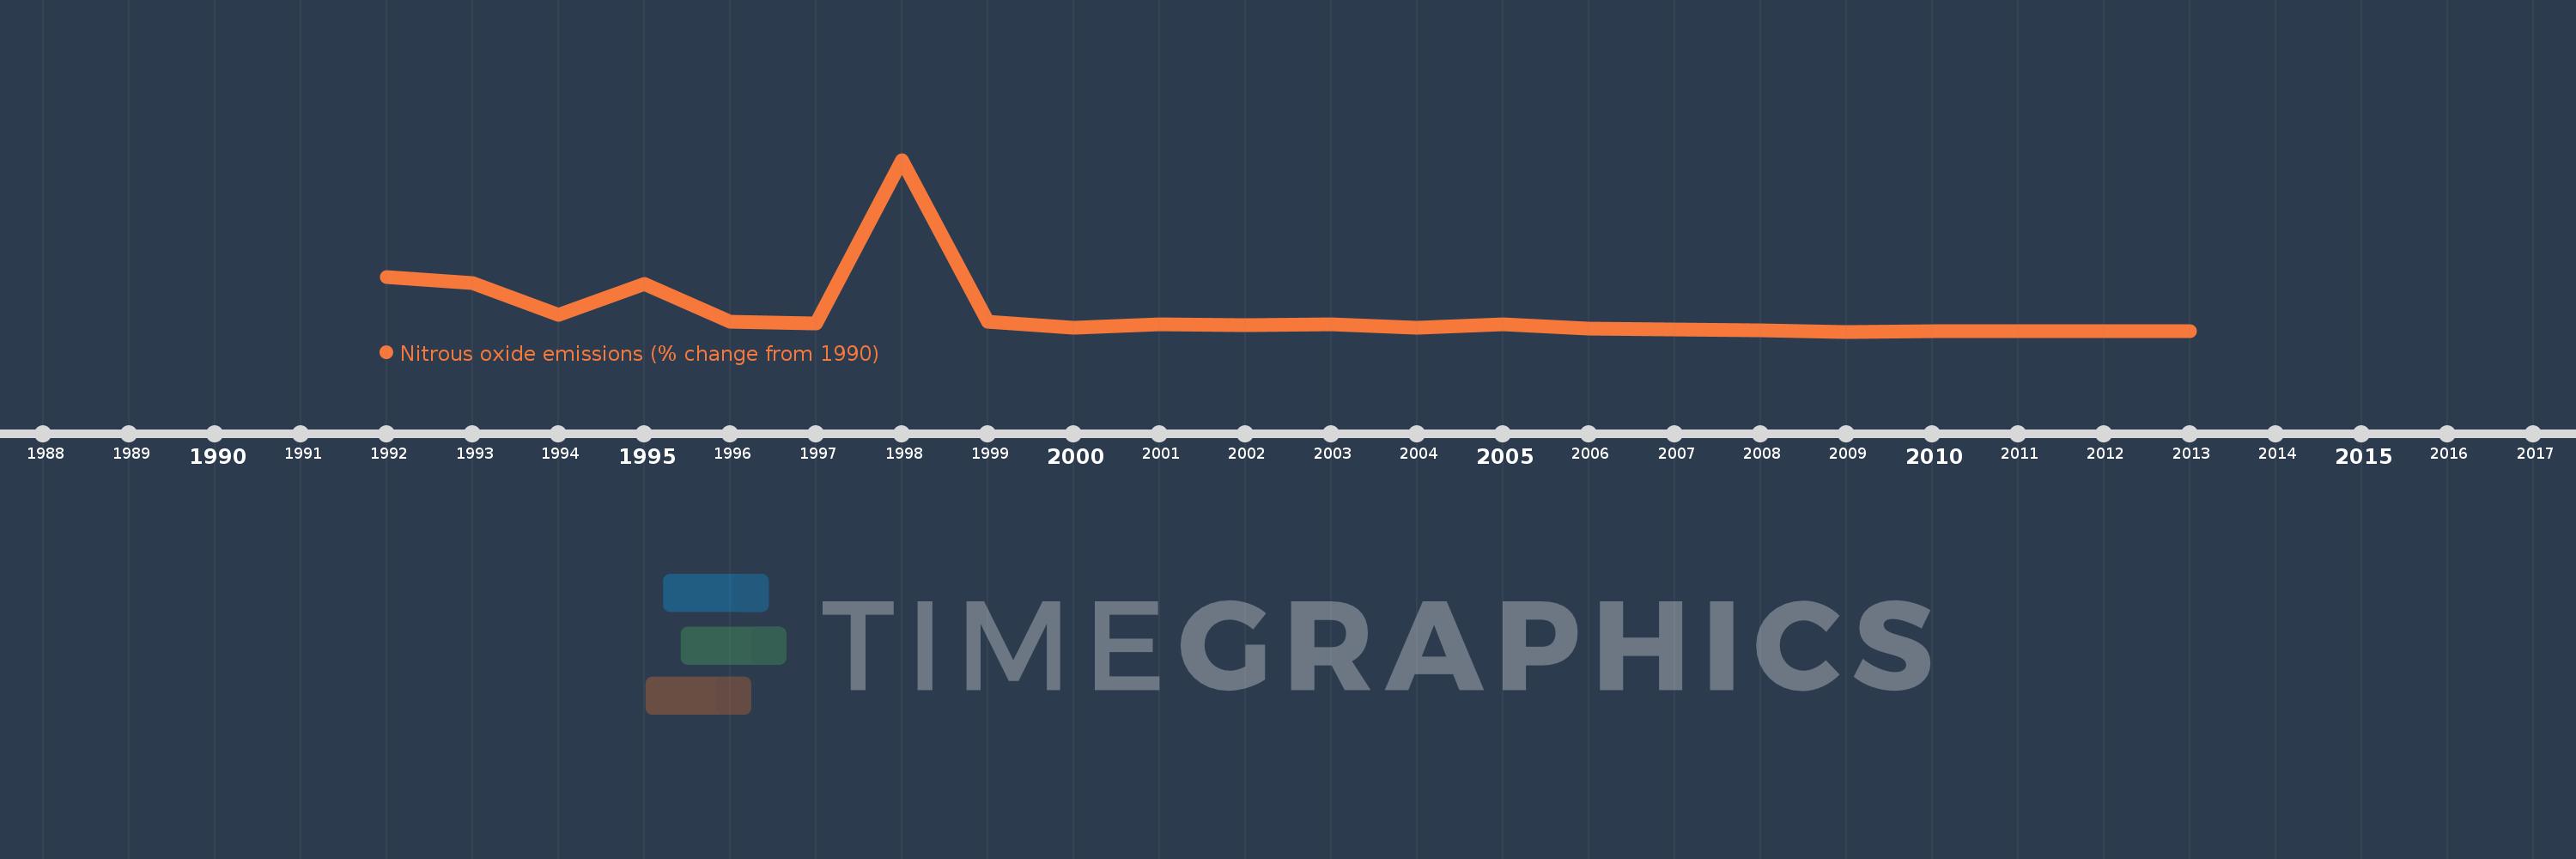
This timeline shows a graph from 1992 to 2013 of Papua New Guinea. No data until 1991. Number of actual observations by date: 22.
Source name:
World Development Indicators
Source organization:
World Bank staff estimates from original source: European Commission, Joint Research Centre (JRC)/Netherlands Environmental Assessment Agency (PBL). Emission Database for Global Atmospheric Research (EDGAR): http://edgar.jrc.ec.europa.eu/.
Categories, topics:
Climate Change, Environment
Last updated:
apr 23, 2017
Indicators value changes by year
Meaning:
21.036
Minimum:
-38.258
jan 1, 2009
Maximum:
506.406
jan 1, 1998
At the date of observation
Value
Absolute change
Change from the previous value
jan 1, 1992
135.866
+135.866
0.0%
jan 1, 1993
114.524
-21.342
-15.71%
jan 1, 1994
14.563
-99.962
-87.28%
jan 1, 1995
112.032
+97.469
669.3%
jan 1, 1996
-6.788
-118.82
-106.06%
jan 1, 1997
-13.111
-6.324
93.16%
jan 1, 1998
506.406
+519.517
-3.96K%
jan 1, 1999
-7.249
-513.655
-101.43%
jan 1, 2000
-25.73
-18.48
254.93%
jan 1, 2001
-16.397
+9.332
-36.27%
jan 1, 2002
-17.123
-0.726
4.42%
jan 1, 2003
-14.0
+3.123
-18.24%
jan 1, 2004
-27.247
-13.247
94.62%
jan 1, 2005
-14.198
+13.049
-47.89%
jan 1, 2006
-28.587
-14.389
101.34%
jan 1, 2007
-31.176
-2.589
9.06%
jan 1, 2008
-35.085
-3.909
12.54%
jan 1, 2009
-38.258
-3.173
9.04%
jan 1, 2010
-35.674
+2.584
-6.75%
jan 1, 2011
-37.283
-1.609
4.51%
jan 1, 2012
-36.656
+0.627
-1.68%
jan 1, 2013
-36.028
+0.627
-1.71%
Ranking of countries by current statistics by years