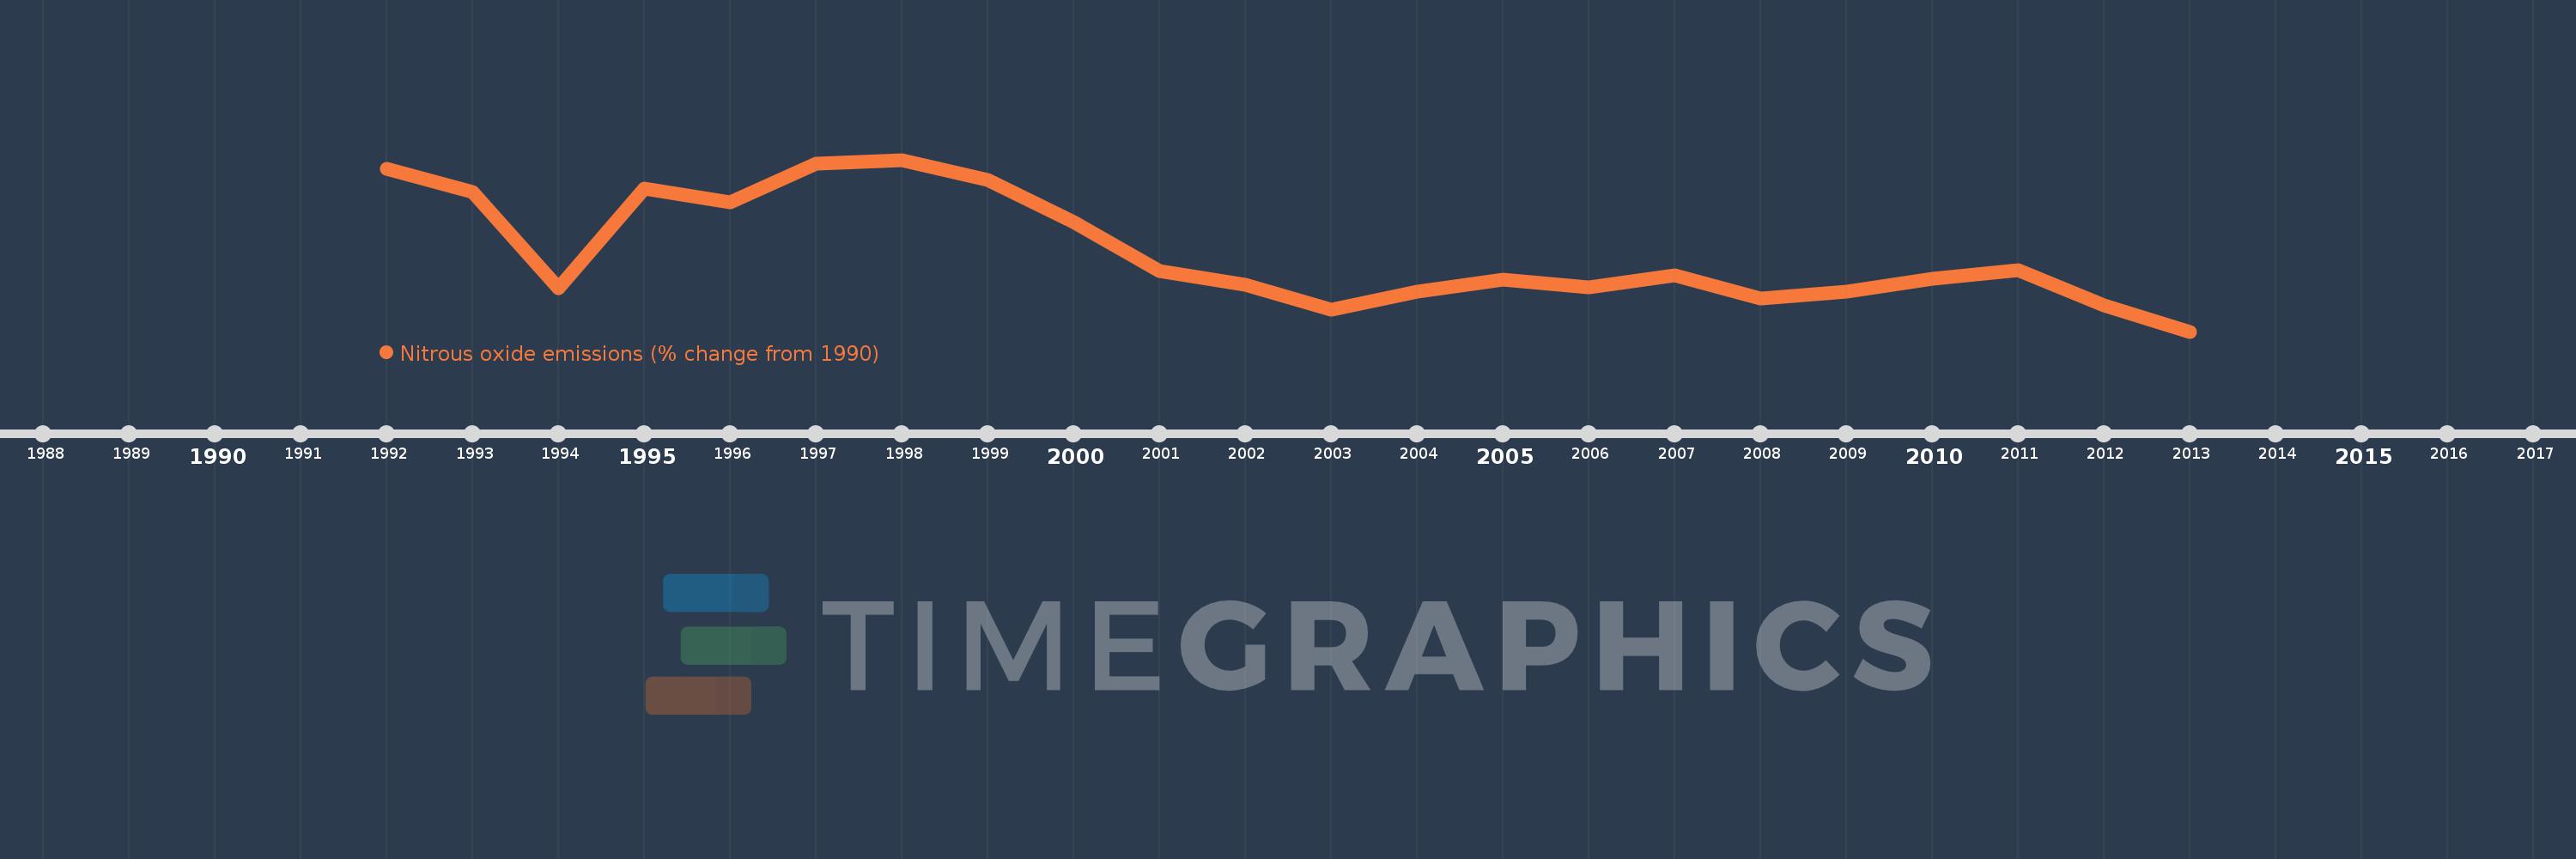
This timeline shows a graph from 1992 to 2013 of Slovak Republic. No data until 1991. Number of actual observations by date: 22.
Source name:
World Development Indicators
Source organization:
World Bank staff estimates from original source: European Commission, Joint Research Centre (JRC)/Netherlands Environmental Assessment Agency (PBL). Emission Database for Global Atmospheric Research (EDGAR): http://edgar.jrc.ec.europa.eu/.
Categories, topics:
Climate Change, Environment
Last updated:
apr 23, 2017
Indicators value changes by year
Meaning:
-31.942
Minimum:
-46.912
jan 1, 2013
Maximum:
-14.669
jan 1, 1998
At the date of observation
Value
Absolute change
Change from the previous value
jan 1, 1992
-16.329
-16.329
0.0%
jan 1, 1993
-20.703
-4.373
26.78%
jan 1, 1994
-38.759
-18.057
87.22%
jan 1, 1995
-20.11
+18.649
-48.11%
jan 1, 1996
-22.593
-2.482
12.34%
jan 1, 1997
-15.398
+7.194
-31.84%
jan 1, 1998
-14.669
+0.729
-4.74%
jan 1, 1999
-18.443
-3.774
25.73%
jan 1, 2000
-26.364
-7.921
42.95%
jan 1, 2001
-35.531
-9.168
34.77%
jan 1, 2002
-38.185
-2.654
7.47%
jan 1, 2003
-42.742
-4.557
11.93%
jan 1, 2004
-39.468
+3.274
-7.66%
jan 1, 2005
-37.158
+2.31
-5.85%
jan 1, 2006
-38.562
-1.404
3.78%
jan 1, 2007
-36.372
+2.19
-5.68%
jan 1, 2008
-40.649
-4.278
11.76%
jan 1, 2009
-39.483
+1.167
-2.87%
jan 1, 2010
-36.945
+2.538
-6.43%
jan 1, 2011
-35.411
+1.534
-4.15%
jan 1, 2012
-41.928
-6.517
18.41%
jan 1, 2013
-46.912
-4.983
11.89%
Ranking of countries by current statistics by years