33
/
AIzaSyAYiBZKx7MnpbEhh9jyipgxe19OcubqV5w
August 1, 2025
190652
Mali
MLI
true
2
1
Nitrous oxide emissions (% change from 1990)
2013,2012,2011,2010,2009,2008,2007,2006,2005,2004,2003,2002,2001,2000,1999,1998,1997,1996,1995,1994,1993,1992
Download
Global statistics library →Mali →

Nitrous oxide emissions (% change from 1990)

This statistics in other country:

AfghanistanAlbaniaAlgeriaAmerican SamoaAndorraAngolaAntigua and BarbudaArab WorldArgentinaArmeniaArubaAustraliaAustriaAzerbaijanBahamas, TheBahrainBangladeshBarbadosBelarusBelgiumBelizeBeninBermudaBhutanBoliviaBosnia and HerzegovinaBotswanaBrazilBritish Virgin IslandsBrunei DarussalamBulgariaBurkina FasoBurundiCabo VerdeCambodiaCameroonCanadaCaribbean small statesCayman IslandsCentral African RepublicCentral Europe and the BalticsChadChileChinaColombiaComorosCongo, Dem. Rep.Congo, Rep.Costa RicaCote d'IvoireCroatiaCubaCyprusCzech RepublicDenmarkDjiboutiDominicaDominican RepublicEarly-demographic dividendEast Asia & PacificEast Asia & Pacific (excluding high income)East Asia & Pacific (IDA & IBRD countries)EcuadorEgypt, Arab Rep.El SalvadorEquatorial GuineaEritreaEstoniaEthiopiaEuro areaEurope & Central AsiaEurope & Central Asia (excluding high income)Europe & Central Asia (IDA & IBRD countries)European UnionFaroe IslandsFijiFinlandFragile and conflict affected situationsFranceFrench PolynesiaGabonGambia, TheGeorgiaGermanyGhanaGibraltarGreeceGreenlandGrenadaGuamGuatemalaGuineaGuinea-BissauGuyanaHaitiHeavily indebted poor countries (HIPC)High incomeHondurasHong Kong SAR, ChinaHungaryIBRD onlyIcelandIDA & IBRD totalIDA blendIDA onlyIDA totalIndiaIndonesiaIran, Islamic Rep.IraqIrelandIsraelItalyJamaicaJapanJordanKazakhstanKenyaKiribatiKorea, Dem. People’s Rep.Korea, Rep.KuwaitKyrgyz RepublicLao PDRLate-demographic dividendLatin America & Caribbean Latin America & Caribbean (excluding high income)Latin America & the Caribbean (IDA & IBRD countries)LatviaLeast developed countries: UN classificationLebanonLesothoLiberiaLibyaLithuaniaLow & middle incomeLow incomeLower middle incomeLuxembourgMacao SAR, ChinaMacedonia, FYRMadagascarMalawiMalaysiaMaldivesMaliMaltaMarshall IslandsMauritaniaMauritiusMexicoMicronesia, Fed. Sts.Middle East & North AfricaMiddle East & North Africa (excluding high income)Middle East & North Africa (IDA & IBRD countries)Middle incomeMoldovaMongoliaMoroccoMozambiqueMyanmarNamibiaNauruNepalNetherlandsNew CaledoniaNew ZealandNicaraguaNigerNigeriaNorth AmericaNorthern Mariana IslandsNorwayOECD membersOmanOther small statesPacific island small statesPakistanPalauPanamaPapua New GuineaParaguayPeruPhilippinesPolandPortugalPost-demographic dividendPre-demographic dividendPuerto RicoQatarRomaniaRussian FederationRwandaSamoaSao Tome and PrincipeSaudi ArabiaSenegalSerbiaSeychellesSierra LeoneSingaporeSlovak RepublicSloveniaSmall statesSolomon IslandsSomaliaSouth AfricaSouth AsiaSouth Asia (IDA & IBRD)SpainSri LankaSt. Kitts and NevisSt. LuciaSt. Vincent and the GrenadinesSub-Saharan Africa Sub-Saharan Africa (excluding high income)Sub-Saharan Africa (IDA & IBRD countries)SudanSurinameSwazilandSwedenSwitzerlandSyrian Arab RepublicTajikistanTanzaniaThailandTimor-LesteTogoTongaTrinidad and TobagoTunisiaTurkeyTurkmenistanTurks and Caicos IslandsTuvaluUgandaUkraineUnited Arab EmiratesUnited KingdomUnited StatesUpper middle incomeUruguayUzbekistanVanuatuVenezuela, RBVietnamVirgin Islands (U.S.)WorldYemen, Rep.ZambiaZimbabwe

Timeline:

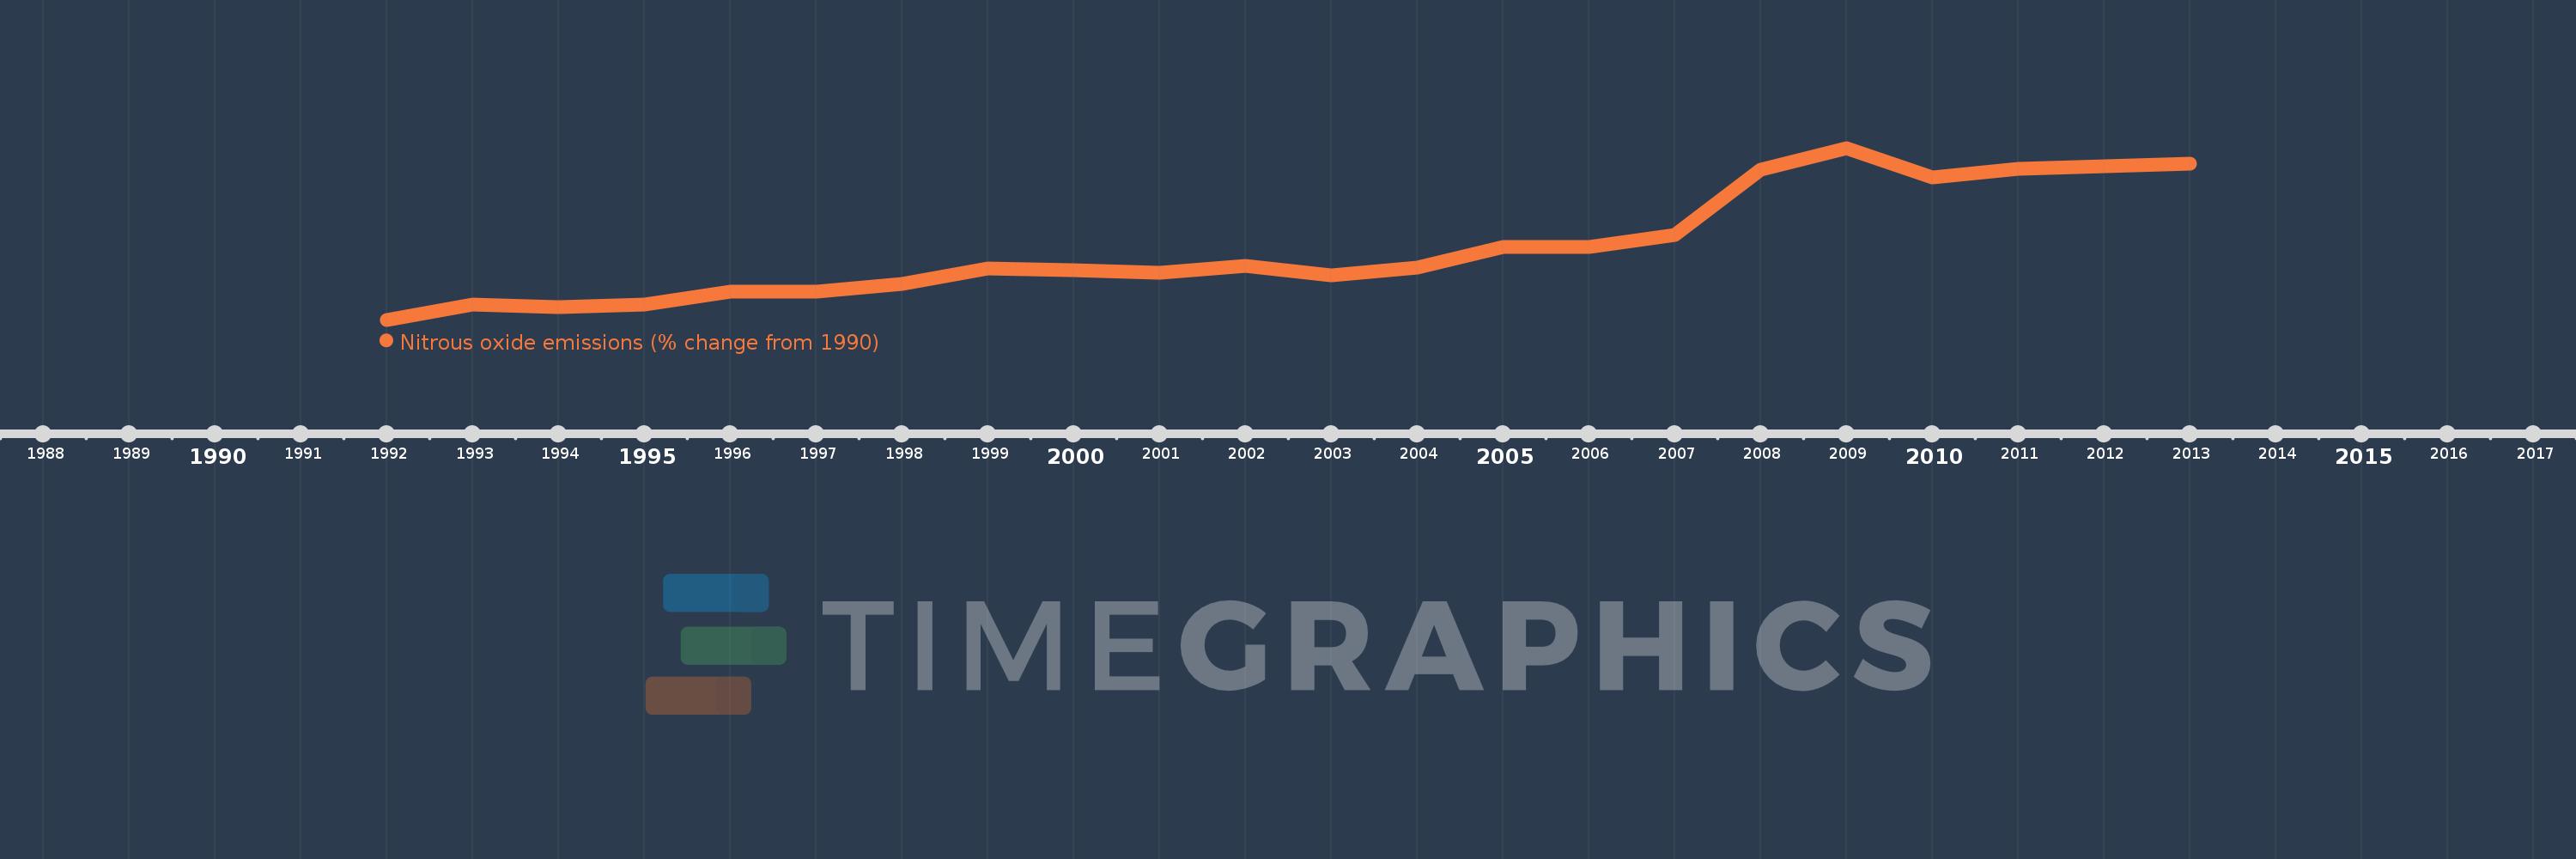
This timeline shows a graph from 1992 to 2013 of Mali. No data until 1991. Number of actual observations by date: 22.

Source name:

World Development Indicators

Source organization:

World Bank staff estimates from original source: European Commission, Joint Research Centre (JRC)/Netherlands Environmental Assessment Agency (PBL). Emission Database for Global Atmospheric Research (EDGAR): http://edgar.jrc.ec.europa.eu/.

Categories, topics:

Climate Change, Environment

Last updated:

apr 23, 2017

Indicators value changes by year

Meaning:
34.038
Minimum:
-12.839
jan 1, 1992
Maximum:
98.759
jan 1, 2009
At the date of observation
Value
Absolute change
Change from the previous value
jan 1, 1992
-12.839
-12.839
0.0%
jan 1, 1993
-3.177
+9.663
-75.26%
jan 1, 1994
-4.899
-1.722
54.22%
jan 1, 1995
-3.095
+1.804
-36.82%
jan 1, 1996
5.342
+8.437
-272.59%
jan 1, 1997
5.677
+0.335
6.27%
jan 1, 1998
10.443
+4.766
83.94%
jan 1, 1999
20.469
+10.026
96.01%
jan 1, 2000
19.255
-1.213
-5.93%
jan 1, 2001
17.48
-1.775
-9.22%
jan 1, 2002
22.209
+4.728
27.05%
jan 1, 2003
15.957
-6.252
-28.15%
jan 1, 2004
21.271
+5.314
33.3%
jan 1, 2005
34.562
+13.292
62.49%
jan 1, 2006
34.695
+0.133
0.38%
jan 1, 2007
42.031
+7.336
21.14%
jan 1, 2008
84.738
+42.707
101.61%
jan 1, 2009
98.759
+14.021
16.55%
jan 1, 2010
79.574
-19.185
-19.43%
jan 1, 2011
84.946
+5.372
6.75%
jan 1, 2012
86.795
+1.849
2.18%
jan 1, 2013
88.645
+1.849
2.13%

Ranking of countries by current statistics by years