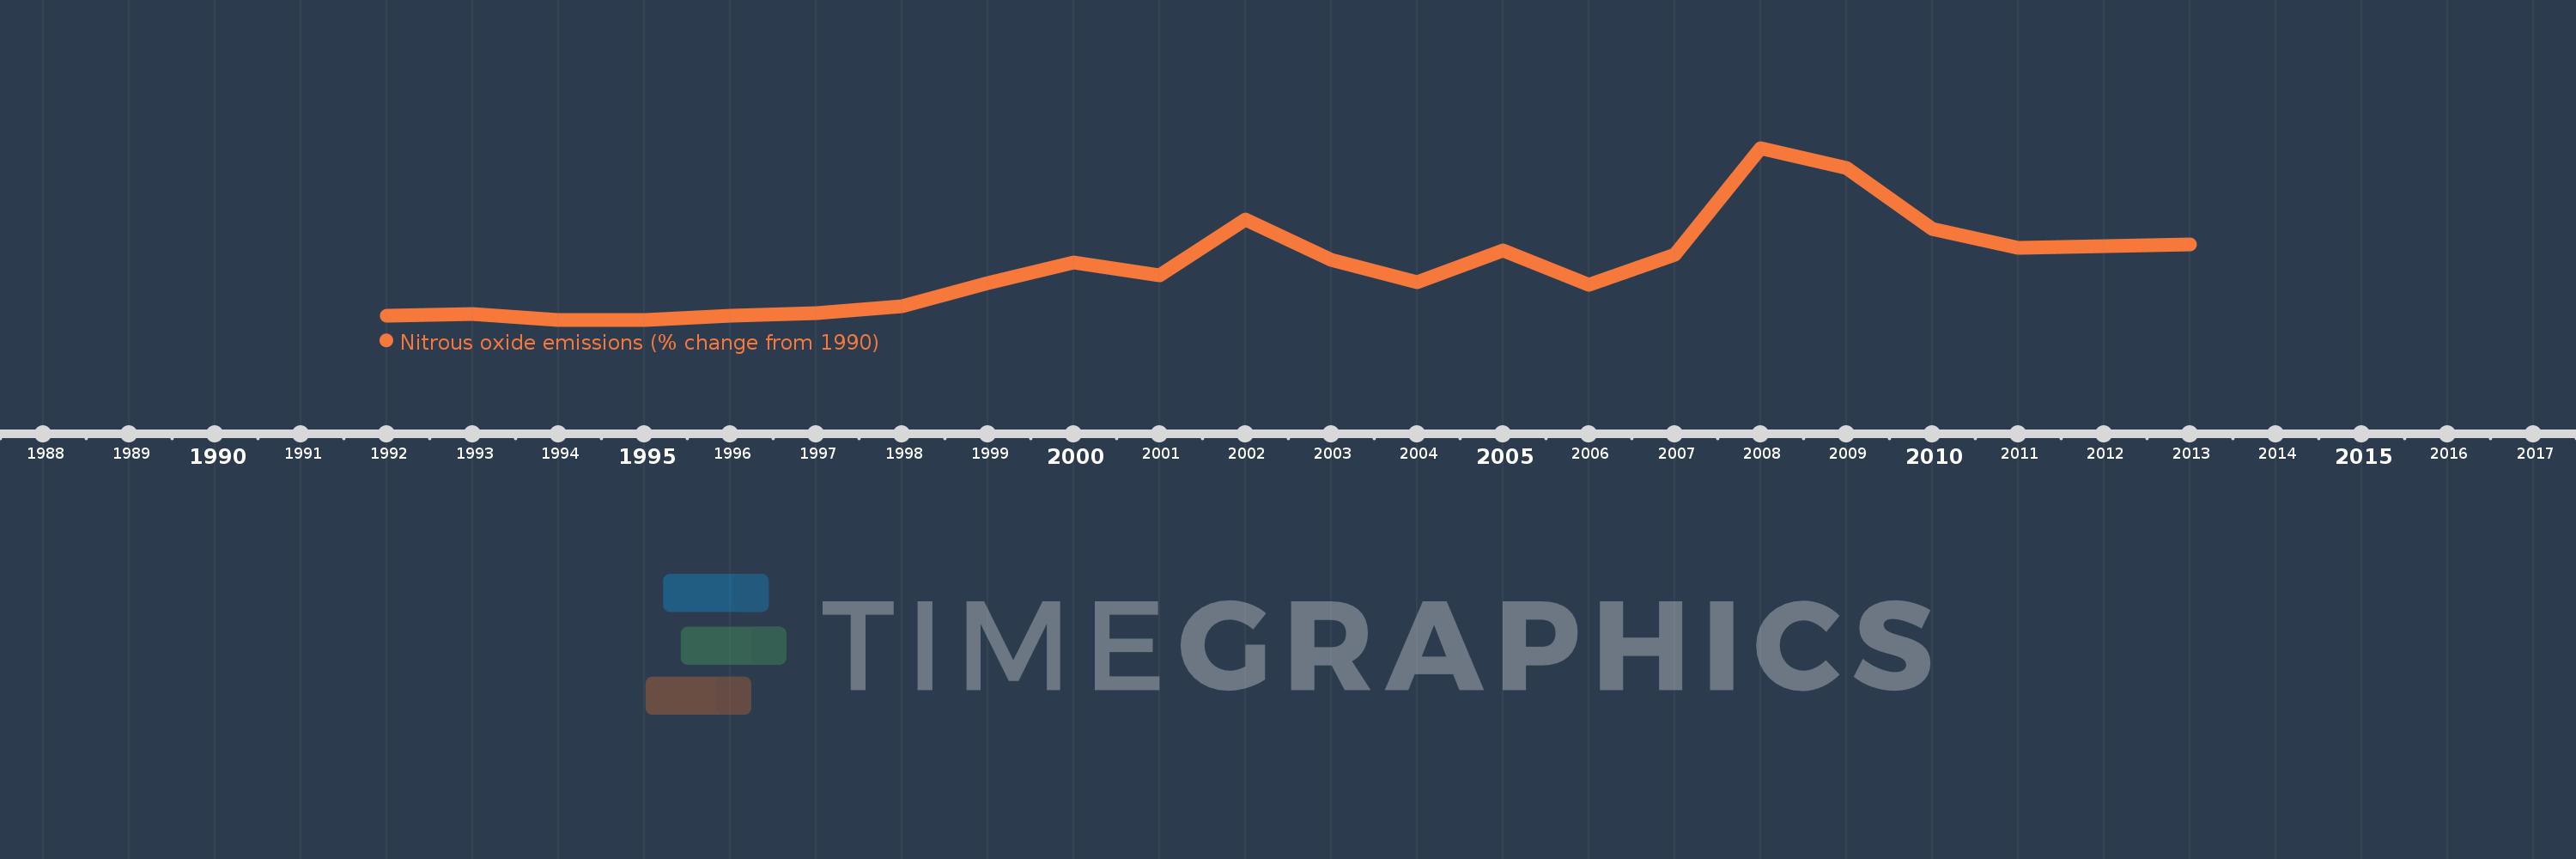
This timeline shows a graph from 1992 to 2013 of Liberia. No data until 1991. Number of actual observations by date: 22.
Source name:
World Development Indicators
Source organization:
World Bank staff estimates from original source: European Commission, Joint Research Centre (JRC)/Netherlands Environmental Assessment Agency (PBL). Emission Database for Global Atmospheric Research (EDGAR): http://edgar.jrc.ec.europa.eu/.
Categories, topics:
Climate Change, Environment
Last updated:
apr 23, 2017
Indicators value changes by year
Meaning:
38.364
Minimum:
-15.949
jan 1, 1995
Maximum:
158.859
jan 1, 2008
At the date of observation
Value
Absolute change
Change from the previous value
jan 1, 1992
-11.95
-11.95
0.0%
jan 1, 1993
-10.038
+1.911
-16.0%
jan 1, 1994
-15.779
-5.74
57.18%
jan 1, 1995
-15.949
-0.17
1.08%
jan 1, 1996
-12.027
+3.921
-24.59%
jan 1, 1997
-9.219
+2.809
-23.35%
jan 1, 1998
-2.638
+6.581
-71.39%
jan 1, 1999
21.082
+23.72
-899.29%
jan 1, 2000
42.567
+21.485
101.91%
jan 1, 2001
29.113
-13.454
-31.61%
jan 1, 2002
86.299
+57.186
196.43%
jan 1, 2003
45.071
-41.228
-47.77%
jan 1, 2004
22.291
-22.779
-50.54%
jan 1, 2005
54.715
+32.424
145.45%
jan 1, 2006
19.627
-35.088
-64.13%
jan 1, 2007
50.024
+30.396
154.87%
jan 1, 2008
158.859
+108.835
217.57%
jan 1, 2009
138.342
-20.517
-12.92%
jan 1, 2010
76.644
-61.698
-44.6%
jan 1, 2011
57.418
-19.226
-25.08%
jan 1, 2012
58.992
+1.574
2.74%
jan 1, 2013
60.566
+1.574
2.67%
Ranking of countries by current statistics by years