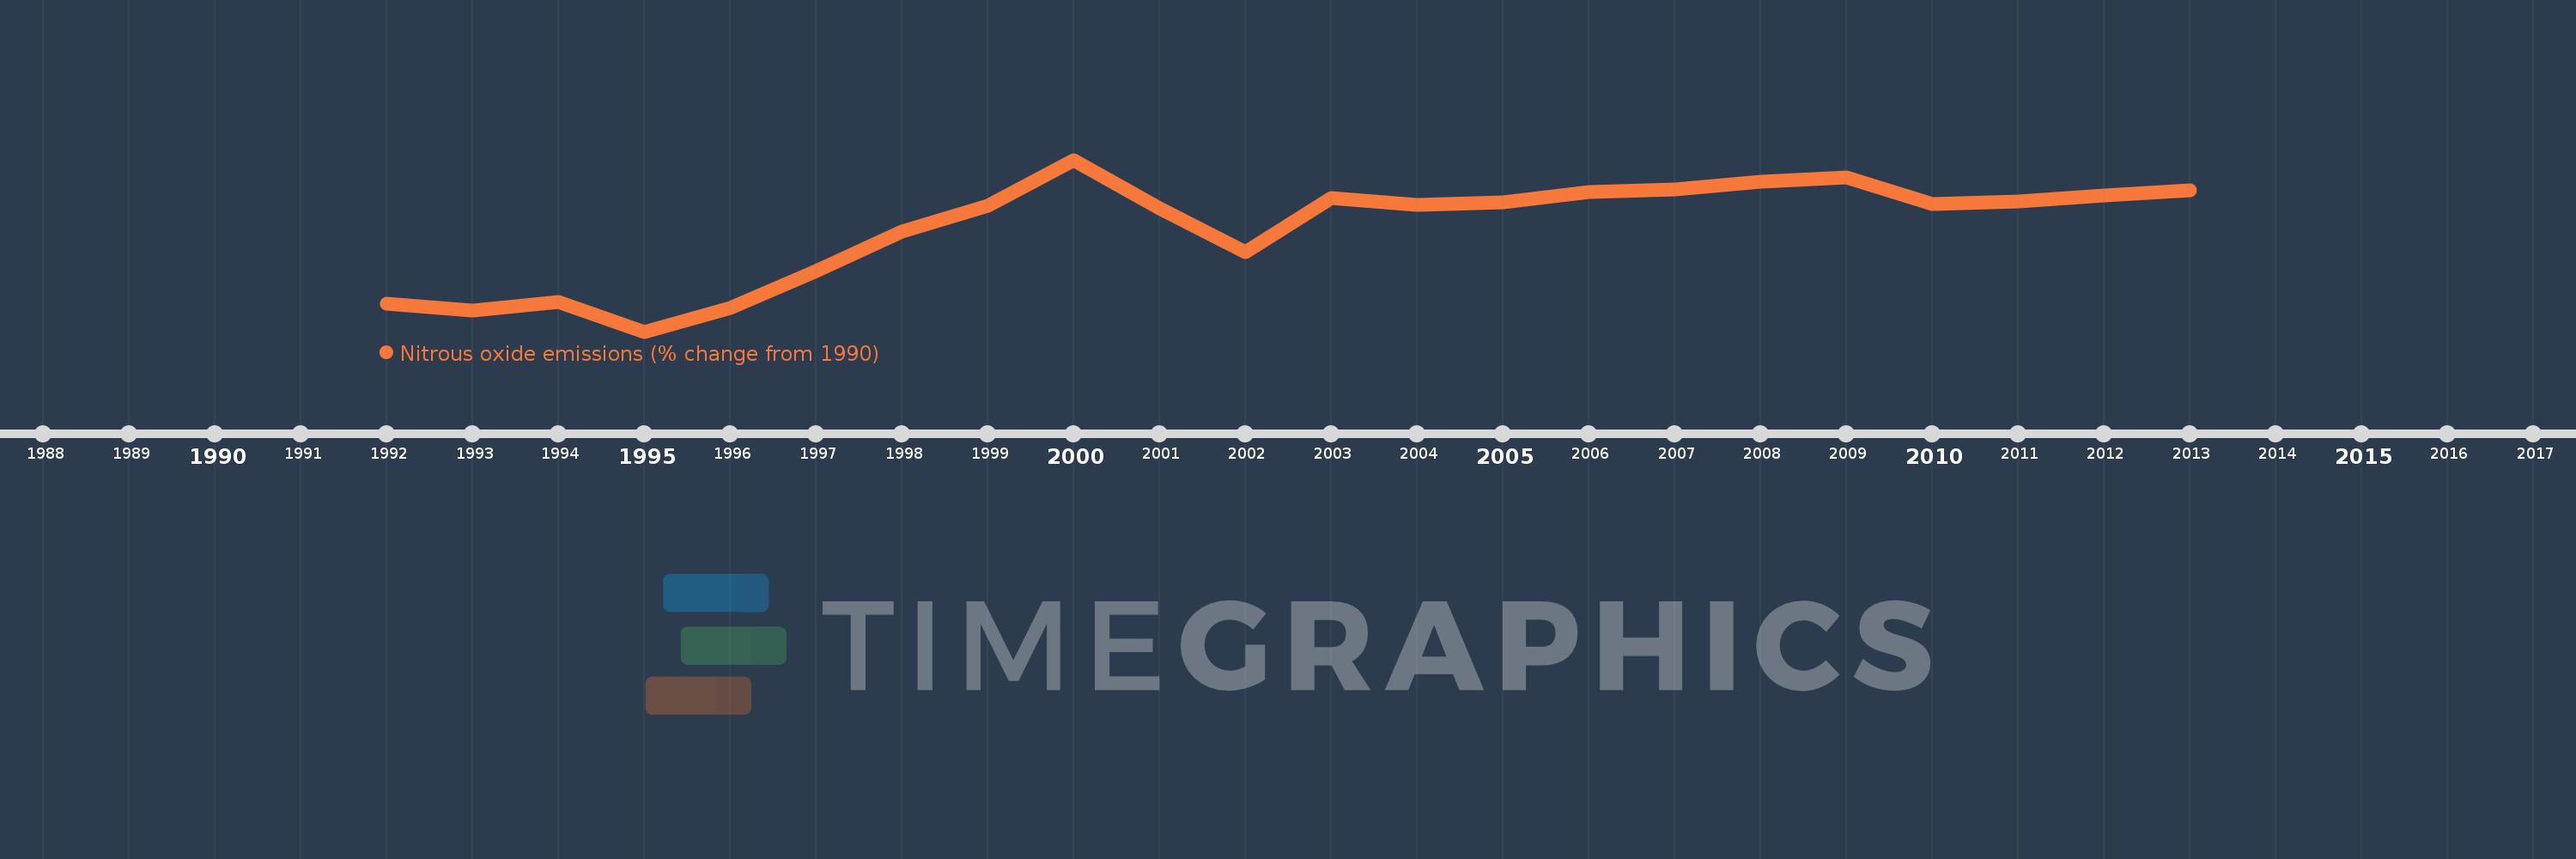
This timeline shows a graph from 1992 to 2013 of Afghanistan. No data until 1991. Number of actual observations by date: 22.
Source name:
World Development Indicators
Source organization:
World Bank staff estimates from original source: European Commission, Joint Research Centre (JRC)/Netherlands Environmental Assessment Agency (PBL). Emission Database for Global Atmospheric Research (EDGAR): http://edgar.jrc.ec.europa.eu/.
Categories, topics:
Climate Change, Environment
Last updated:
apr 23, 2017
Indicators value changes by year
Meaning:
16.42
Minimum:
-5.595
jan 1, 1995
Maximum:
31.015
jan 1, 2000
At the date of observation
Value
Absolute change
Change from the previous value
jan 1, 1992
0.28
+0.28
0.0%
jan 1, 1993
-1.062
-1.342
-479.14%
jan 1, 1994
0.672
+1.733
-163.24%
jan 1, 1995
-5.595
-6.267
-933.24%
jan 1, 1996
-0.475
+5.12
-91.51%
jan 1, 1997
7.3
+7.775
-1.64K%
jan 1, 1998
15.639
+8.34
114.25%
jan 1, 1999
21.279
+5.64
36.06%
jan 1, 2000
31.015
+9.736
45.75%
jan 1, 2001
20.682
-10.334
-33.32%
jan 1, 2002
11.306
-9.376
-45.34%
jan 1, 2003
22.795
+11.49
101.63%
jan 1, 2004
21.428
-1.367
-6.0%
jan 1, 2005
21.984
+0.556
2.6%
jan 1, 2006
24.145
+2.16
9.83%
jan 1, 2007
24.668
+0.523
2.17%
jan 1, 2008
26.278
+1.61
6.53%
jan 1, 2009
27.256
+0.978
3.72%
jan 1, 2010
21.576
-5.68
-20.84%
jan 1, 2011
22.137
+0.561
2.6%
jan 1, 2012
23.358
+1.221
5.52%
jan 1, 2013
24.579
+1.221
5.23%
Ranking of countries by current statistics by years