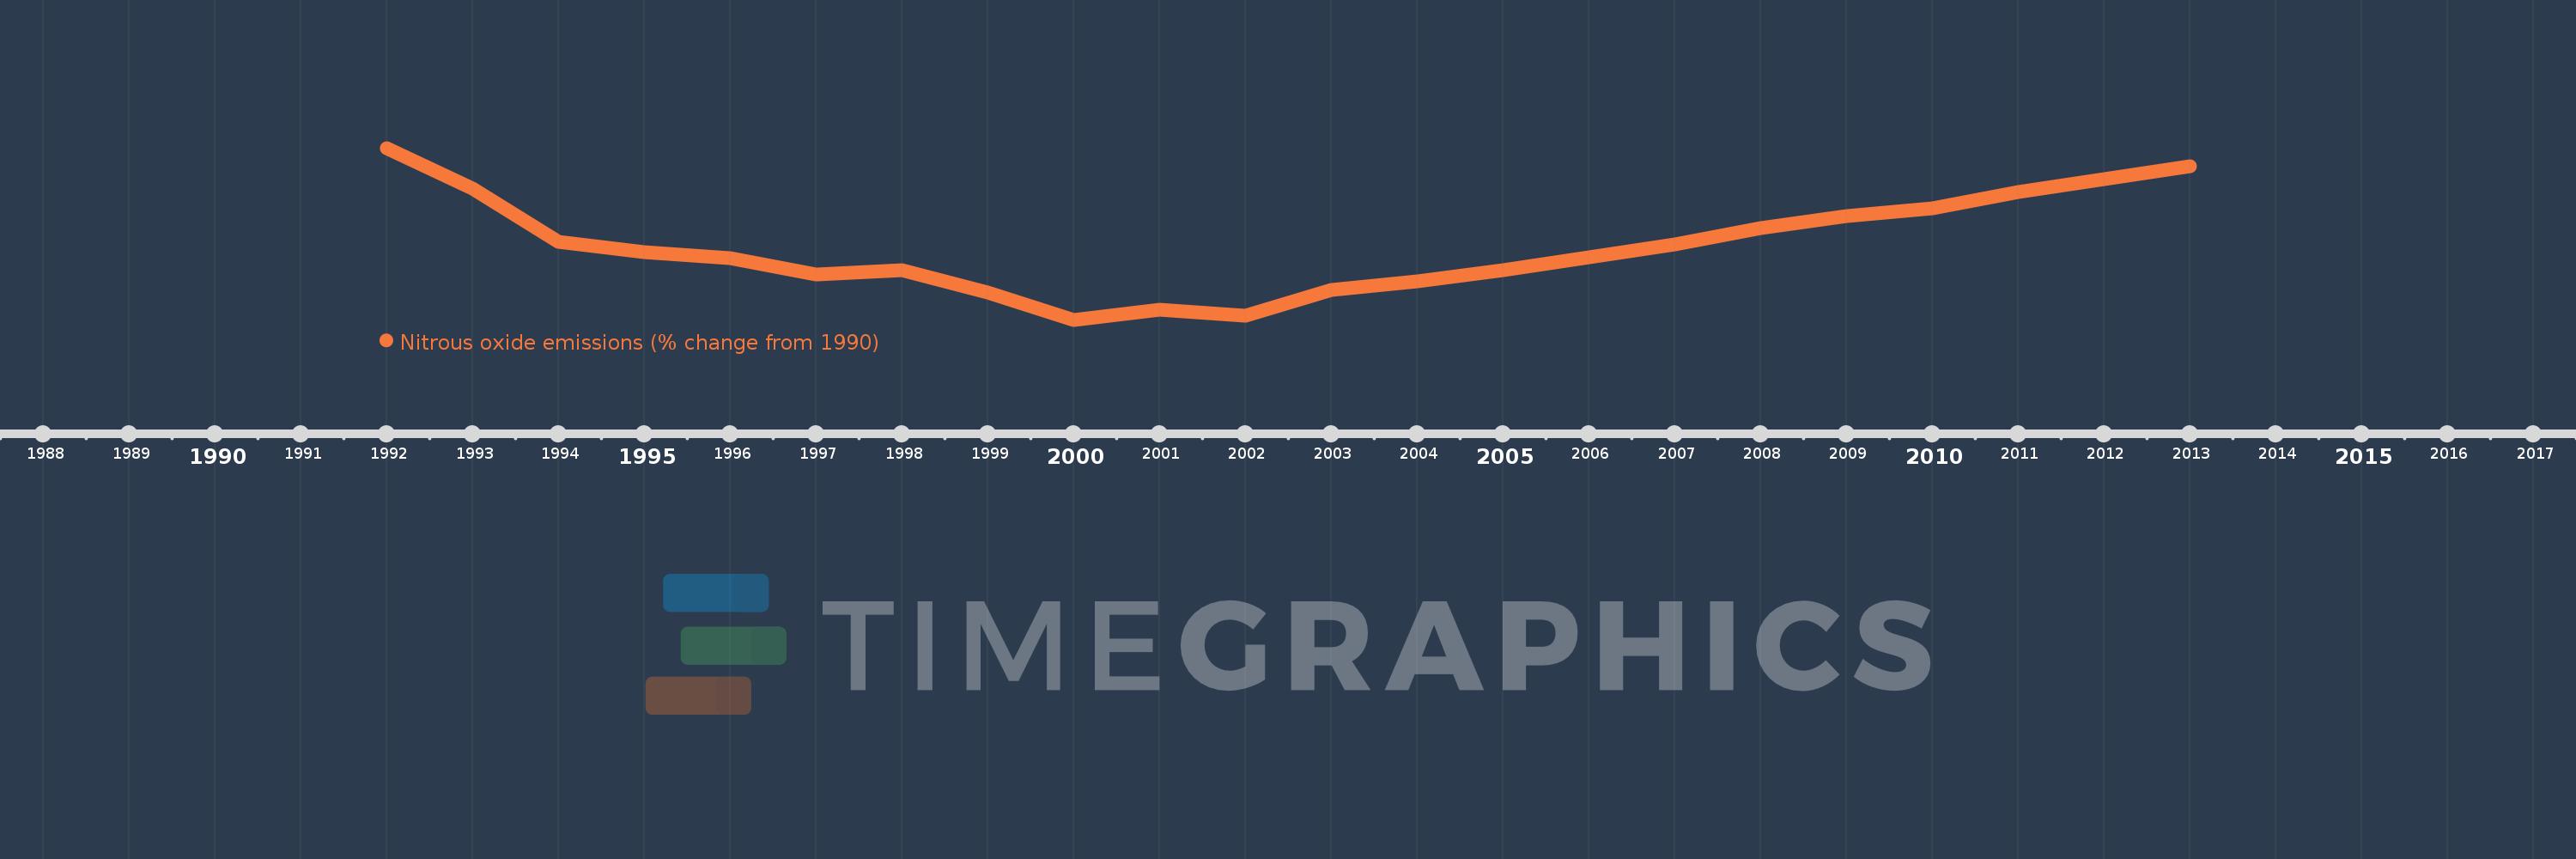
This timeline shows a graph from 1992 to 2013 of Tajikistan. No data until 1991. Number of actual observations by date: 22.
Source name:
World Development Indicators
Source organization:
World Bank staff estimates from original source: European Commission, Joint Research Centre (JRC)/Netherlands Environmental Assessment Agency (PBL). Emission Database for Global Atmospheric Research (EDGAR): http://edgar.jrc.ec.europa.eu/.
Categories, topics:
Climate Change, Environment
Last updated:
apr 23, 2017
Indicators value changes by year
Meaning:
-4.301
Minimum:
-29.734
jan 1, 2000
Maximum:
29.257
jan 1, 1992
At the date of observation
Value
Absolute change
Change from the previous value
jan 1, 1992
29.257
+29.257
0.0%
jan 1, 1993
15.191
-14.066
-48.08%
jan 1, 1994
-3.046
-18.237
-120.05%
jan 1, 1995
-6.535
-3.488
114.52%
jan 1, 1996
-8.698
-2.163
33.11%
jan 1, 1997
-14.14
-5.442
62.56%
jan 1, 1998
-12.654
+1.485
-10.51%
jan 1, 1999
-20.447
-7.793
61.59%
jan 1, 2000
-29.734
-9.287
45.42%
jan 1, 2001
-26.208
+3.526
-11.86%
jan 1, 2002
-28.427
-2.219
8.47%
jan 1, 2003
-19.593
+8.835
-31.08%
jan 1, 2004
-16.572
+3.021
-15.42%
jan 1, 2005
-12.724
+3.848
-23.22%
jan 1, 2006
-8.153
+4.571
-35.92%
jan 1, 2007
-3.782
+4.371
-53.61%
jan 1, 2008
1.696
+5.478
-144.85%
jan 1, 2009
5.968
+4.271
251.8%
jan 1, 2010
8.399
+2.431
40.74%
jan 1, 2011
14.185
+5.786
68.9%
jan 1, 2012
18.523
+4.338
30.58%
jan 1, 2013
22.862
+4.338
23.42%
Ranking of countries by current statistics by years