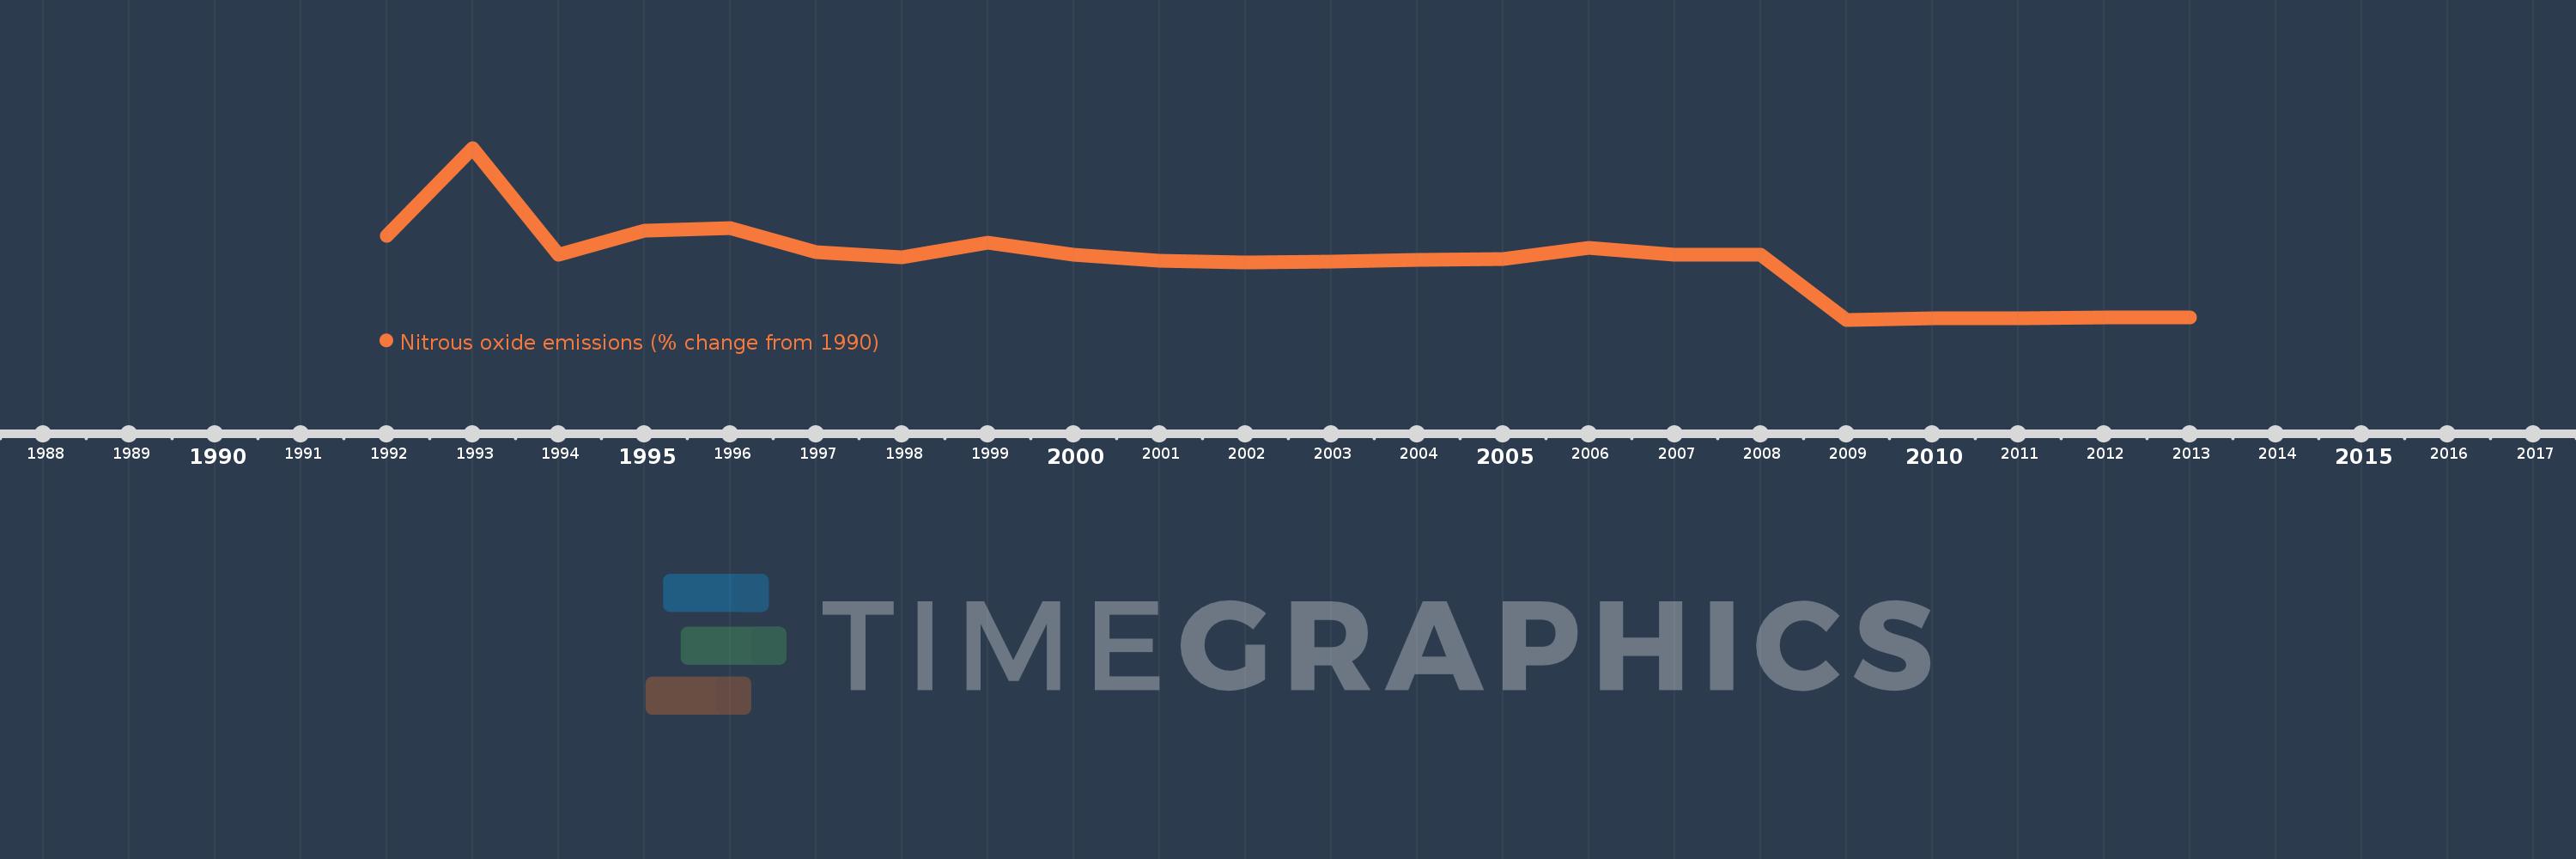
This timeline shows a graph from 1992 to 2013 of Zambia. No data until 1991. Number of actual observations by date: 22.
Source name:
World Development Indicators
Source organization:
World Bank staff estimates from original source: European Commission, Joint Research Centre (JRC)/Netherlands Environmental Assessment Agency (PBL). Emission Database for Global Atmospheric Research (EDGAR): http://edgar.jrc.ec.europa.eu/.
Categories, topics:
Climate Change, Environment
Last updated:
apr 23, 2017
Indicators value changes by year
Meaning:
-38.673
Minimum:
-77.566
jan 1, 2009
Maximum:
37.479
jan 1, 1993
At the date of observation
Value
Absolute change
Change from the previous value
jan 1, 1992
-21.31
-21.31
0.0%
jan 1, 1993
37.479
+58.789
-275.87%
jan 1, 1994
-33.949
-71.428
-190.58%
jan 1, 1995
-18.159
+15.79
-46.51%
jan 1, 1996
-16.06
+2.1
-11.56%
jan 1, 1997
-32.067
-16.007
99.67%
jan 1, 1998
-35.761
-3.694
11.52%
jan 1, 1999
-25.83
+9.93
-27.77%
jan 1, 2000
-33.859
-8.028
31.08%
jan 1, 2001
-38.129
-4.27
12.61%
jan 1, 2002
-38.963
-0.834
2.19%
jan 1, 2003
-38.634
+0.329
-0.84%
jan 1, 2004
-37.716
+0.918
-2.38%
jan 1, 2005
-37.088
+0.628
-1.67%
jan 1, 2006
-29.478
+7.609
-20.52%
jan 1, 2007
-34.29
-4.812
16.32%
jan 1, 2008
-33.768
+0.522
-1.52%
jan 1, 2009
-77.566
-43.799
129.71%
jan 1, 2010
-76.874
+0.693
-0.89%
jan 1, 2011
-76.499
+0.375
-0.49%
jan 1, 2012
-76.264
+0.235
-0.31%
jan 1, 2013
-76.029
+0.235
-0.31%
Ranking of countries by current statistics by years