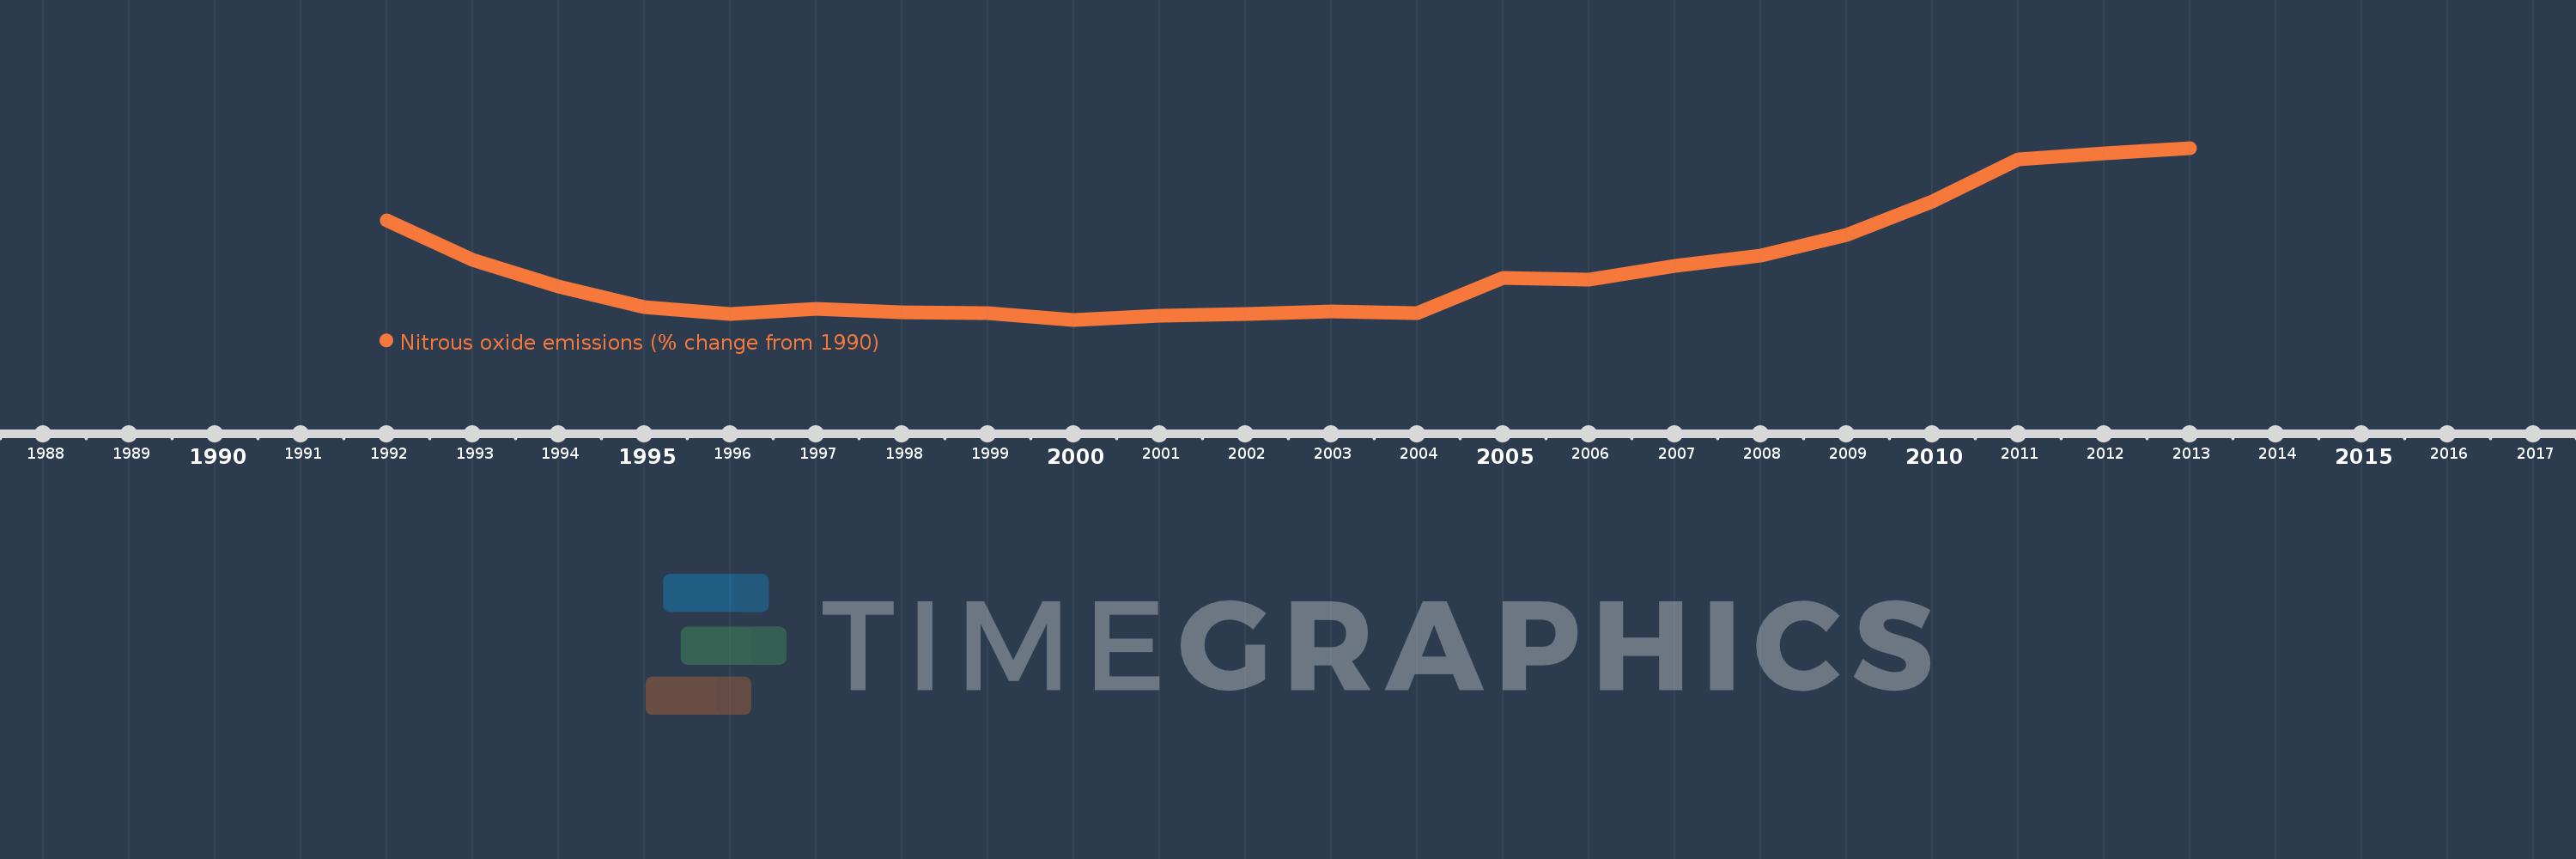
This timeline shows a graph from 1992 to 2013 of Armenia. No data until 1991. Number of actual observations by date: 22.
Source name:
World Development Indicators
Source organization:
World Bank staff estimates from original source: European Commission, Joint Research Centre (JRC)/Netherlands Environmental Assessment Agency (PBL). Emission Database for Global Atmospheric Research (EDGAR): http://edgar.jrc.ec.europa.eu/.
Categories, topics:
Climate Change, Environment
Last updated:
apr 23, 2017
Indicators value changes by year
Meaning:
-22.348
Minimum:
-44.259
jan 1, 2000
Maximum:
27.043
jan 1, 2013
At the date of observation
Value
Absolute change
Change from the previous value
jan 1, 1992
-3.111
-3.111
0.0%
jan 1, 1993
-19.293
-16.182
520.19%
jan 1, 1994
-30.567
-11.274
58.44%
jan 1, 1995
-39.181
-8.614
28.18%
jan 1, 1996
-41.847
-2.666
6.8%
jan 1, 1997
-39.709
+2.138
-5.11%
jan 1, 1998
-41.328
-1.62
4.08%
jan 1, 1999
-41.595
-0.266
0.64%
jan 1, 2000
-44.259
-2.665
6.41%
jan 1, 2001
-42.654
+1.605
-3.63%
jan 1, 2002
-41.883
+0.771
-1.81%
jan 1, 2003
-40.628
+1.255
-3.0%
jan 1, 2004
-41.362
-0.734
1.81%
jan 1, 2005
-26.979
+14.383
-34.77%
jan 1, 2006
-27.528
-0.549
2.04%
jan 1, 2007
-22.024
+5.504
-19.99%
jan 1, 2008
-17.718
+4.306
-19.55%
jan 1, 2009
-9.159
+8.559
-48.31%
jan 1, 2010
4.922
+14.081
-153.74%
jan 1, 2011
22.45
+17.529
356.15%
jan 1, 2012
24.747
+2.296
10.23%
jan 1, 2013
27.043
+2.296
9.28%
Ranking of countries by current statistics by years