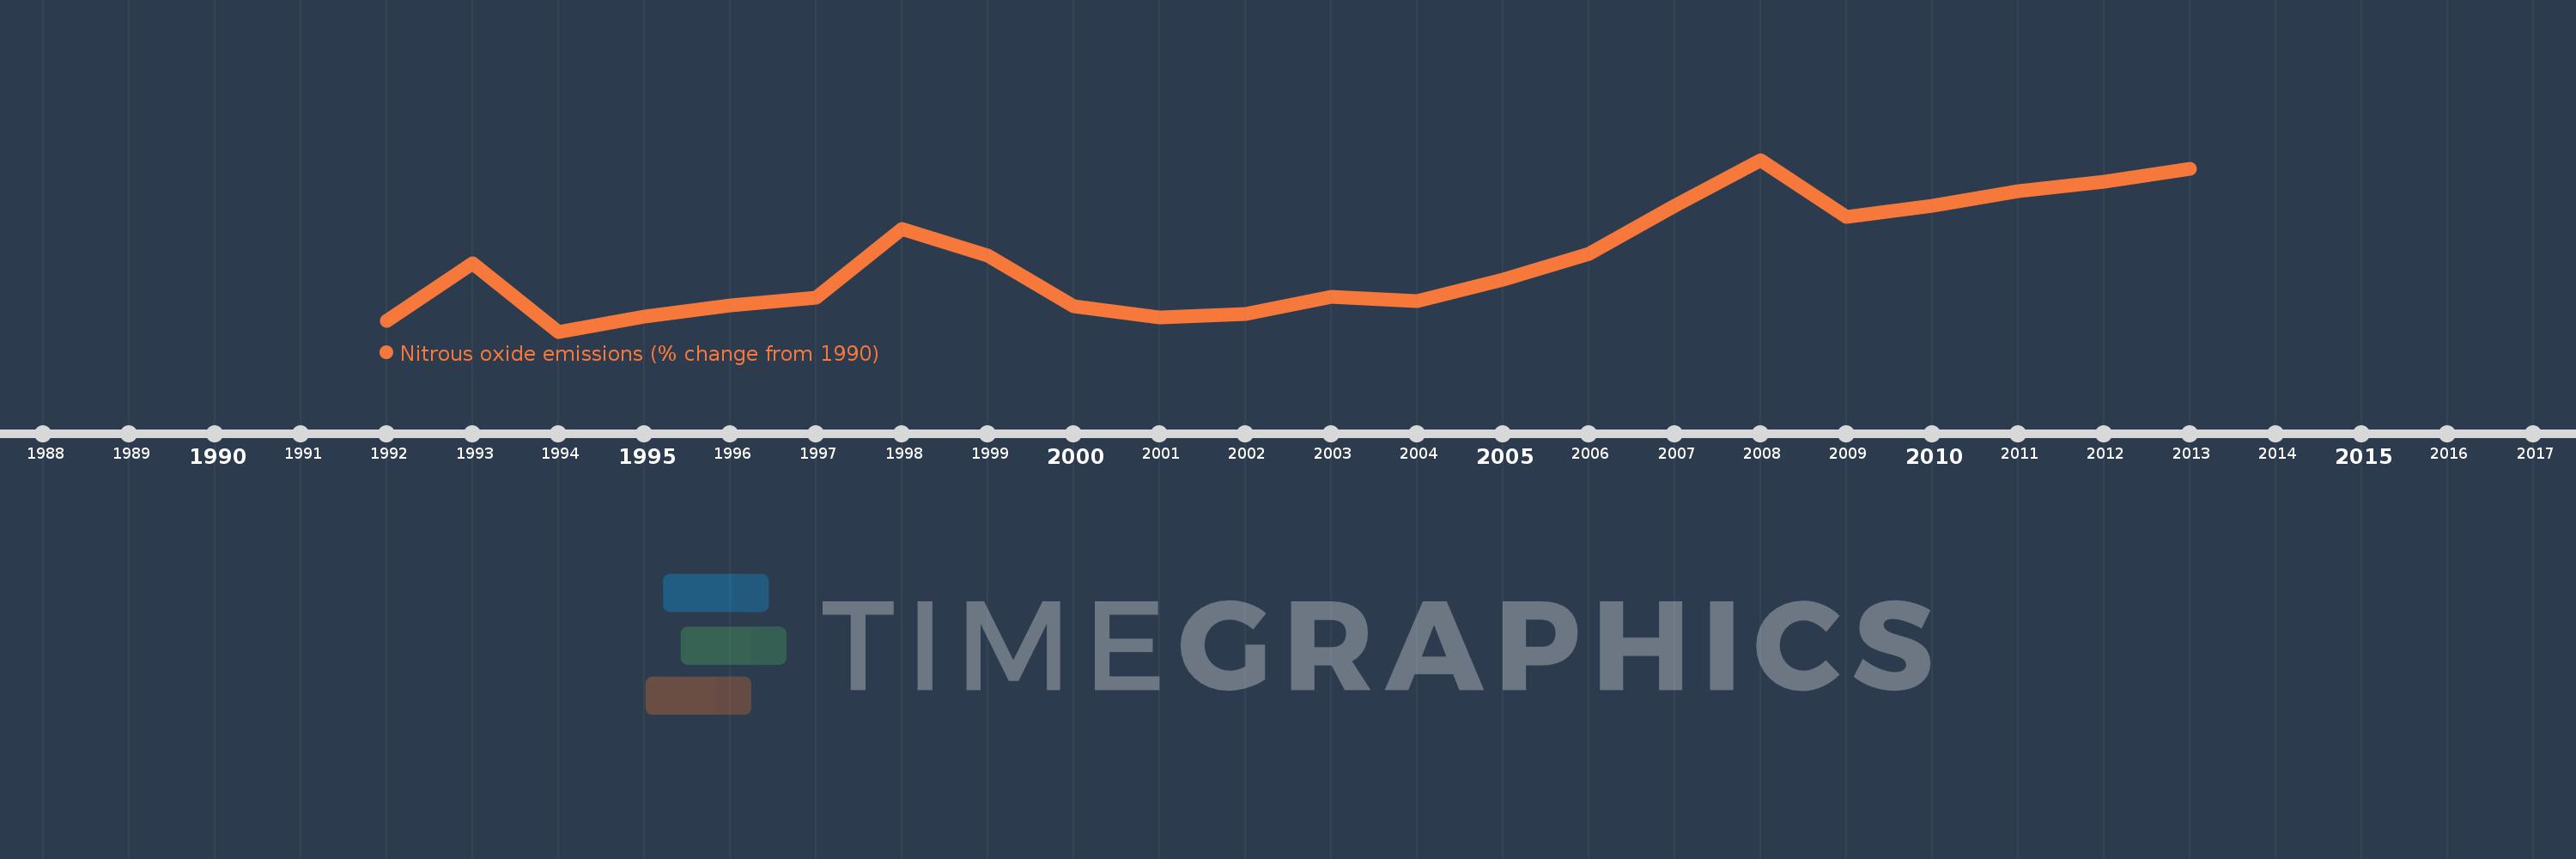
This timeline shows a graph from 1992 to 2013 of IDA & IBRD total. No data until 1991. Number of actual observations by date: 22.
Source name:
World Development Indicators
Source organization:
World Bank staff estimates from original source: European Commission, Joint Research Centre (JRC)/Netherlands Environmental Assessment Agency (PBL). Emission Database for Global Atmospheric Research (EDGAR): http://edgar.jrc.ec.europa.eu/.
Categories, topics:
Climate Change, Environment
Last updated:
apr 23, 2017
Indicators value changes by year
Meaning:
7.128
Minimum:
-4.144
jan 1, 1994
Maximum:
22.843
jan 1, 2008
At the date of observation
Value
Absolute change
Change from the previous value
jan 1, 1992
-2.506
-2.506
0.0%
jan 1, 1993
6.642
+9.148
-365.02%
jan 1, 1994
-4.144
-10.786
-162.4%
jan 1, 1995
-1.743
+2.401
-57.93%
jan 1, 1996
0.017
+1.76
-100.95%
jan 1, 1997
1.23
+1.213
7.32K%
jan 1, 1998
12.025
+10.795
877.8%
jan 1, 1999
7.835
-4.19
-34.85%
jan 1, 2000
-0.1
-7.935
-101.28%
jan 1, 2001
-1.888
-1.787
1.78K%
jan 1, 2002
-1.339
+0.549
-29.06%
jan 1, 2003
1.285
+2.624
-195.97%
jan 1, 2004
0.671
-0.614
-47.79%
jan 1, 2005
4.05
+3.38
503.75%
jan 1, 2006
8.021
+3.971
98.04%
jan 1, 2007
15.68
+7.659
95.48%
jan 1, 2008
22.843
+7.163
45.68%
jan 1, 2009
13.827
-9.016
-39.47%
jan 1, 2010
15.647
+1.82
13.16%
jan 1, 2011
17.918
+2.271
14.52%
jan 1, 2012
19.457
+1.539
8.59%
jan 1, 2013
21.384
+1.928
9.91%
Ranking of countries by current statistics by years