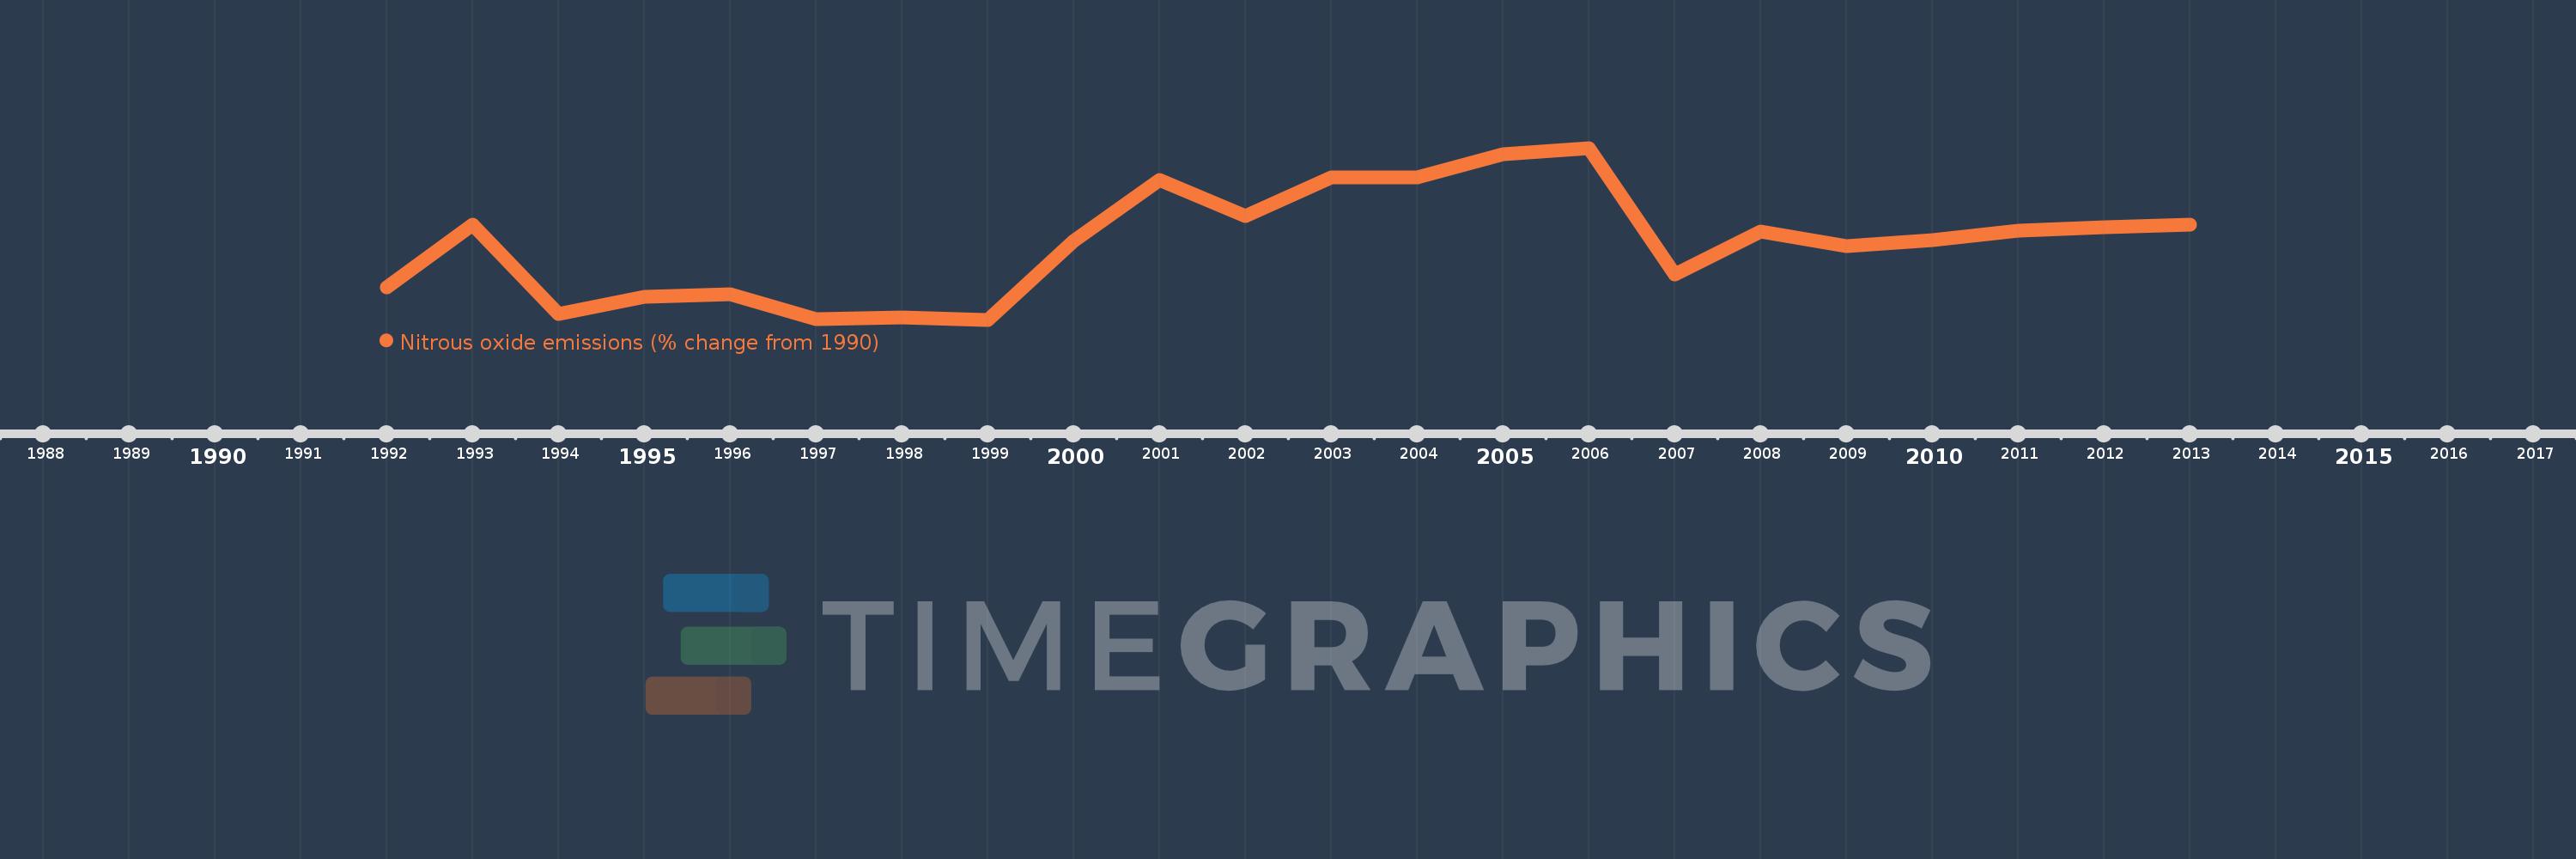
This timeline shows a graph from 1992 to 2013 of Namibia. No data until 1991. Number of actual observations by date: 22.
Source name:
World Development Indicators
Source organization:
World Bank staff estimates from original source: European Commission, Joint Research Centre (JRC)/Netherlands Environmental Assessment Agency (PBL). Emission Database for Global Atmospheric Research (EDGAR): http://edgar.jrc.ec.europa.eu/.
Categories, topics:
Climate Change, Environment
Last updated:
apr 23, 2017
Indicators value changes by year
Meaning:
12.094
Minimum:
-19.185
jan 1, 1999
Maximum:
50.631
jan 1, 2006
At the date of observation
Value
Absolute change
Change from the previous value
jan 1, 1992
-6.024
-6.024
0.0%
jan 1, 1993
19.581
+25.605
-425.08%
jan 1, 1994
-16.809
-36.39
-185.84%
jan 1, 1995
-9.76
+7.049
-41.94%
jan 1, 1996
-8.773
+0.987
-10.11%
jan 1, 1997
-18.93
-10.157
115.78%
jan 1, 1998
-18.25
+0.68
-3.59%
jan 1, 1999
-19.185
-0.936
5.13%
jan 1, 2000
12.827
+32.012
-166.86%
jan 1, 2001
37.559
+24.732
192.81%
jan 1, 2002
22.957
-14.602
-38.88%
jan 1, 2003
38.624
+15.667
68.24%
jan 1, 2004
38.622
-0.001
0.0%
jan 1, 2005
47.961
+9.339
24.18%
jan 1, 2006
50.631
+2.669
5.57%
jan 1, 2007
-0.682
-51.312
-101.35%
jan 1, 2008
16.702
+17.384
-2.55K%
jan 1, 2009
10.903
-5.799
-34.72%
jan 1, 2010
13.289
+2.386
21.88%
jan 1, 2011
17.101
+3.812
28.69%
jan 1, 2012
18.272
+1.171
6.85%
jan 1, 2013
19.443
+1.171
6.41%
Ranking of countries by current statistics by years