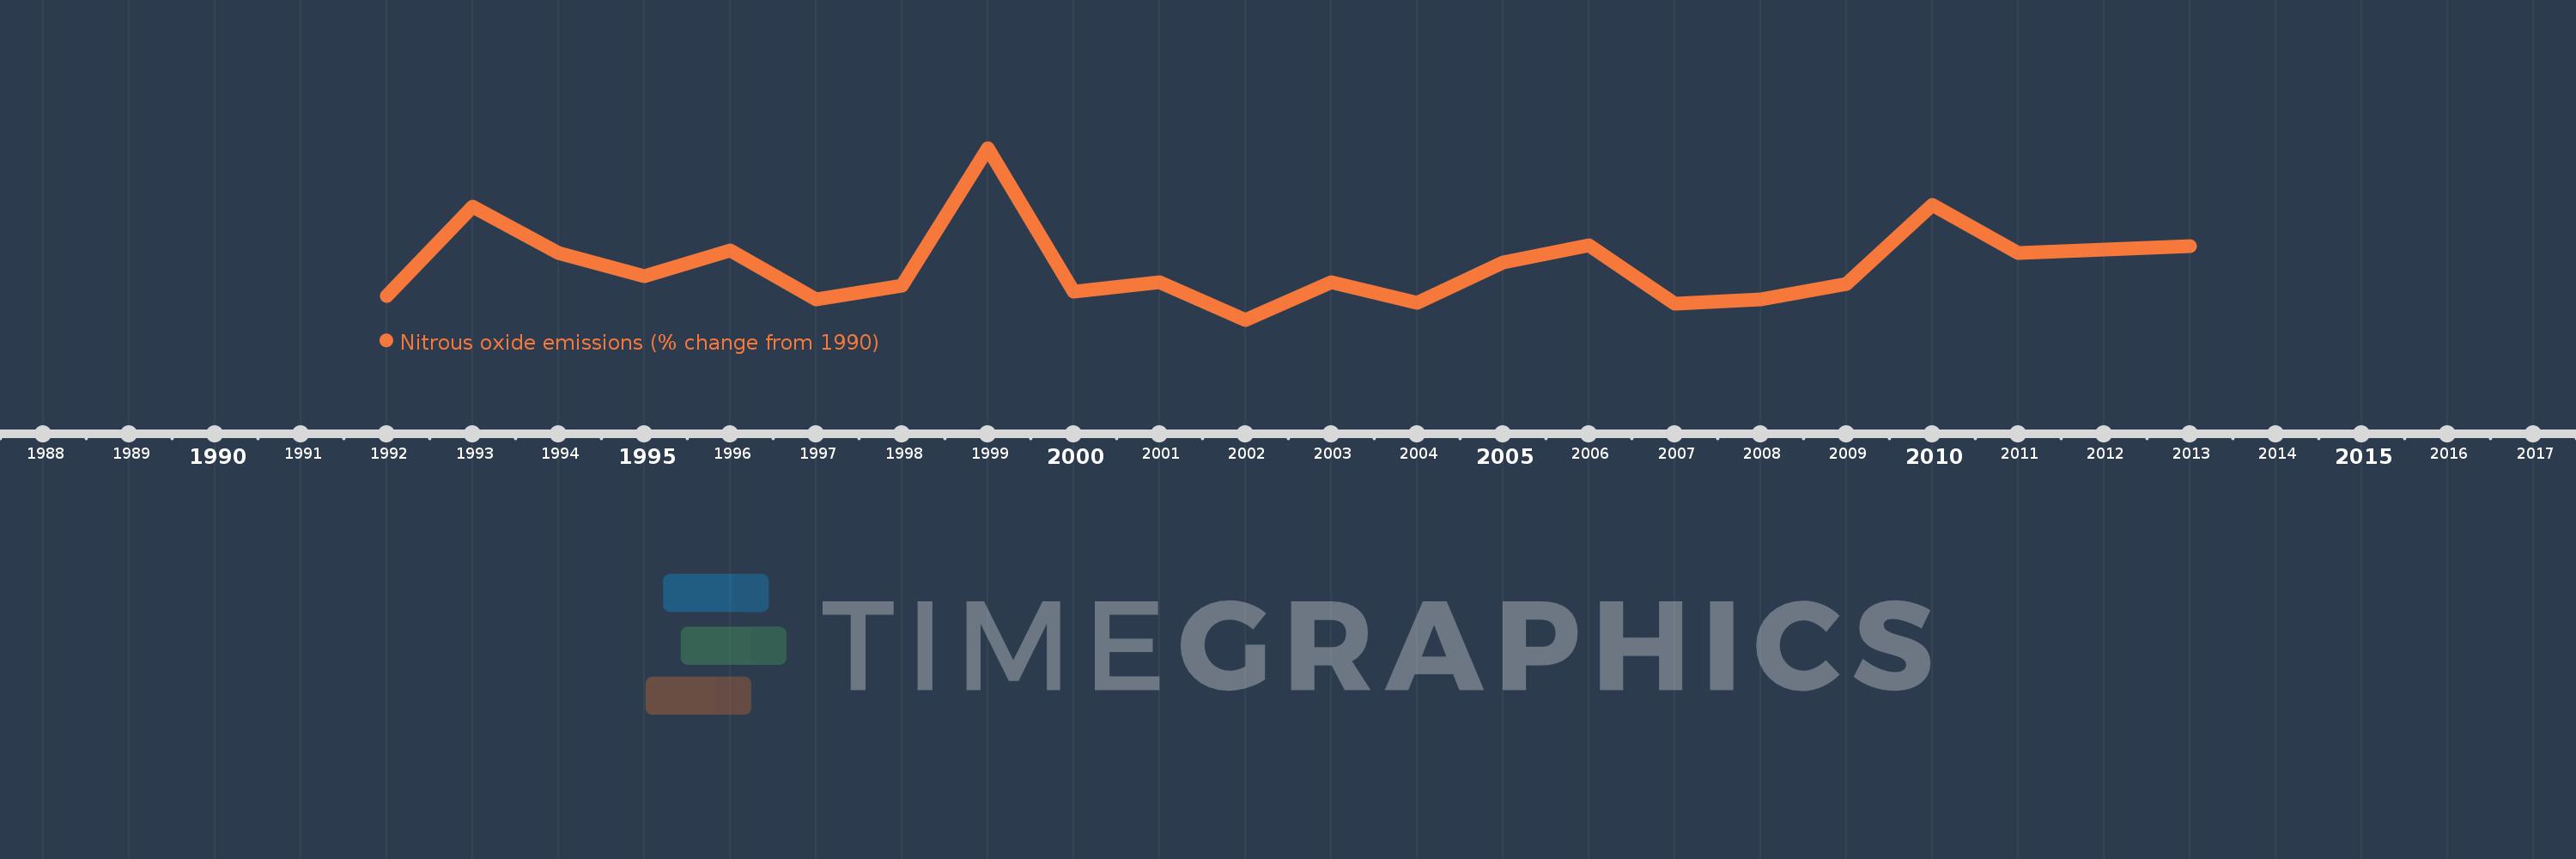
This timeline shows a graph from 1992 to 2013 of Malaysia. No data until 1991. Number of actual observations by date: 22.
Source name:
World Development Indicators
Source organization:
World Bank staff estimates from original source: European Commission, Joint Research Centre (JRC)/Netherlands Environmental Assessment Agency (PBL). Emission Database for Global Atmospheric Research (EDGAR): http://edgar.jrc.ec.europa.eu/.
Categories, topics:
Climate Change, Environment
Last updated:
apr 23, 2017
Indicators value changes by year
Meaning:
3.678
Minimum:
-12.349
jan 1, 2002
Maximum:
38.352
jan 1, 1999
At the date of observation
Value
Absolute change
Change from the previous value
jan 1, 1992
-5.265
-5.265
0.0%
jan 1, 1993
20.99
+26.255
-498.69%
jan 1, 1994
7.334
-13.657
-65.06%
jan 1, 1995
0.46
-6.874
-93.73%
jan 1, 1996
8.152
+7.692
1.67K%
jan 1, 1997
-6.334
-14.485
-177.7%
jan 1, 1998
-2.21
+4.124
-65.11%
jan 1, 1999
38.352
+40.561
-1.84K%
jan 1, 2000
-3.998
-42.35
-110.42%
jan 1, 2001
-1.147
+2.851
-71.3%
jan 1, 2002
-12.349
-11.202
976.33%
jan 1, 2003
-1.238
+11.111
-89.97%
jan 1, 2004
-7.312
-6.073
490.47%
jan 1, 2005
4.524
+11.836
-161.88%
jan 1, 2006
9.618
+5.094
112.58%
jan 1, 2007
-7.542
-17.161
-178.42%
jan 1, 2008
-6.363
+1.18
-15.64%
jan 1, 2009
-1.668
+4.695
-73.79%
jan 1, 2010
21.628
+23.296
-1.4K%
jan 1, 2011
7.352
-14.276
-66.01%
jan 1, 2012
8.425
+1.074
14.6%
jan 1, 2013
9.499
+1.074
12.74%
Ranking of countries by current statistics by years