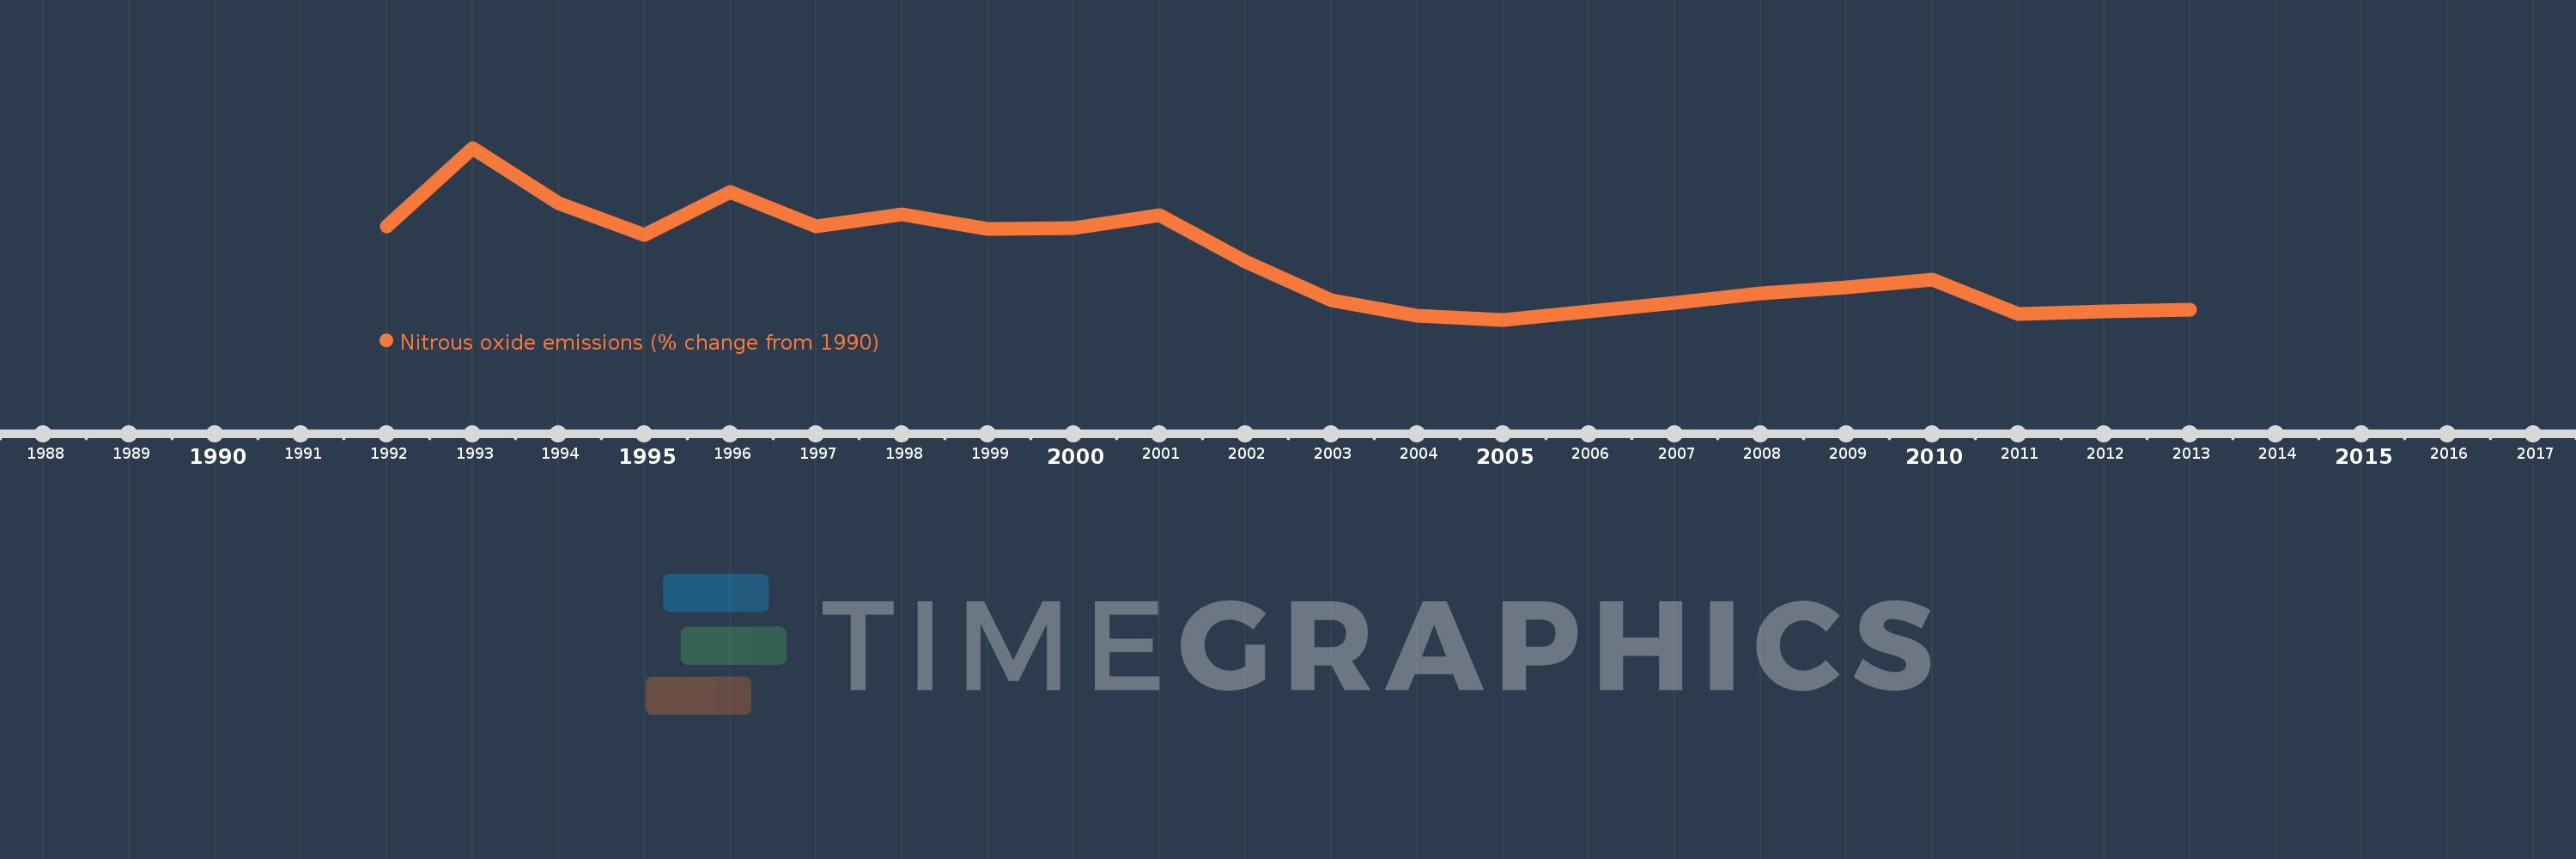
This timeline shows a graph from 1992 to 2013 of Mongolia. No data until 1991. Number of actual observations by date: 22.
Source name:
World Development Indicators
Source organization:
World Bank staff estimates from original source: European Commission, Joint Research Centre (JRC)/Netherlands Environmental Assessment Agency (PBL). Emission Database for Global Atmospheric Research (EDGAR): http://edgar.jrc.ec.europa.eu/.
Categories, topics:
Climate Change, Environment
Last updated:
apr 23, 2017
Indicators value changes by year
Meaning:
-15.808
Minimum:
-34.367
jan 1, 2005
Maximum:
19.089
jan 1, 1993
At the date of observation
Value
Absolute change
Change from the previous value
jan 1, 1992
-5.422
-5.422
0.0%
jan 1, 1993
19.089
+24.511
-452.08%
jan 1, 1994
1.967
-17.123
-89.7%
jan 1, 1995
-8.029
-9.996
-508.23%
jan 1, 1996
5.487
+13.516
-168.34%
jan 1, 1997
-5.286
-10.773
-196.35%
jan 1, 1998
-1.599
+3.687
-69.75%
jan 1, 1999
-5.986
-4.387
274.37%
jan 1, 2000
-5.743
+0.243
-4.06%
jan 1, 2001
-1.809
+3.934
-68.5%
jan 1, 2002
-16.142
-14.332
792.25%
jan 1, 2003
-28.245
-12.104
74.99%
jan 1, 2004
-33.2
-4.955
17.54%
jan 1, 2005
-34.367
-1.166
3.51%
jan 1, 2006
-31.87
+2.496
-7.26%
jan 1, 2007
-29.187
+2.683
-8.42%
jan 1, 2008
-26.096
+3.091
-10.59%
jan 1, 2009
-24.182
+1.914
-7.34%
jan 1, 2010
-21.76
+2.422
-10.01%
jan 1, 2011
-32.473
-10.713
49.23%
jan 1, 2012
-31.798
+0.675
-2.08%
jan 1, 2013
-31.123
+0.675
-2.12%
Ranking of countries by current statistics by years